Content Marketing ROI: Metriken zur Messung des Markenwerts
Mithilfe dieser Schritt-für-Schritt-Anleitung können Sie den ROI Ihres Content Marketings messen und die Wirksamkeit Ihrer Inhalte nachweisen.

Wenn es um ihre größte Herausforderung geht, sind sich die meisten Content Marketer einig: Sie tun sich schwer damit, den Return on Investment (ROI) von Content Marketing zu messen.
Auf unseren Konferenzen und Workshops ist das die Frage, die uns am häufigsten gestellt wird: "Wie kann ich die Wirksamkeit meiner Inhalte messen?"
Und das ist verständlich.
Viele Jahre lang haben die Teams für digitales Marketing ihren Erfolg an Kennzahlen wie Seitenaufrufen und Impressionen gemessen.
Das lag vor allem daran, dass wir durch die damals verfügbare Technik und die Messinstrumente eingeschränkt waren.
Als sich die Branche weiterentwickelte, wurde klar, dass diese Metriken ein besserer Indikator für Eitelkeitsmetriken waren, die die Werbeausgaben in die Höhe trieben, als für Qualität oder Markenwachstum.
Mit der Zeit begann eine neue Ära des Marketings, die sich auf das Engagement konzentrierte. Um den ROI von Content Marketing besser nachweisen zu können, wandten sich die Vermarkter Kennzahlen wie Aufmerksamkeit, Conversion-Rates, Bounce-Rate und Verweildauer auf der Seite zu.
Jetzt suchen die Vermarkter nach noch mehr Beweisen dafür, dass ihre Content Marketing Bemühungen zu echten Geschäftsergebnissen führen.
Wenn sie sich mit CMOs treffen und ihre Content-Budgets verteidigen, müssen Marketingspezialisten harte Kennzahlen vorlegen und beweisen, dass ihre Content Marketingstrategie zu echten Geschäftsergebnissen führt, die eine Leadgenerierung ermöglichen.
Aufgrund dieser Nachfrage und der Möglichkeit, die Customer Journey besser zu verfolgen, treten wir in eine Ära der Leistungsmessung ein.
Alle Content Marketing-Kampagnen werden an die Erreichung von Geschäftszielen geknüpft sein - und die Vermarkter werden in der Lage sein, den Content Marketing-ROI mit ihrer Arbeit zu messen.
An diesem Punkt gibt es eine klare Verbindung zwischen Content Marketing und dem Verbraucherverhalten.
Die Artikel, die Menschen lesen, die Videos, die sie sehen, die Podcasts, die sie hören, die Webinare, die sie besuchen, und die Fallstudien, die sie konsumieren, beeinflussen letztendlich ihre Kaufentscheidungen. Laut Nielsen befasst sich eine Person durchschnittlich mit 11,4 Inhalten, bevor sie einen Kauf tätigt.
Bei Welcome haben wir herausgefunden, dass Menschen sich mit etwa 20 Inhalten beschäftigen, bevor sie zu Kunden werden. Und bei Interessenten, die unseren Blog gelesen, an einem Webinar teilgenommen oder unseren E-Mail-Newsletter abonniert haben, ist die Wahrscheinlichkeit doppelt so hoch, dass sie einen Termin mit uns vereinbaren, um mehr über unsere Content Marketing-Plattform zu erfahren.
Wir konnten dies feststellen, weil wir die Systeme zur Messung des Content Marketing ROI eingerichtet haben.
Und sind Sie bereit für eine tolle Nachricht?
Das können Sie auch.
Sie müssen nur Ihre Geschäftsziele festlegen und Systeme einrichten, um die entsprechenden Kennzahlen zu verfolgen. (Und noch eine gute Nachricht: Sie können dies tun, ohne technischen Support zu benötigen oder neue Analyseprogramme zu kaufen).
Wenn Google Analytics also nicht Ihr Ding ist oder wenn Sie etwas suchen, das Google Analytics ergänzt, dann haben wir etwas für Sie.
Das erfordert zwar ein wenig Vorarbeit, aber sobald diese Systeme eingerichtet sind, können Sie definitiv feststellen, wie gut Ihre Content Marketing-Bemühungen funktionieren.
Wenn Sie sich an dieser schrittweisen Roadmap zur Optimierung orientieren, können Sie den echten, messbaren ROI des Content Marketing ernten.
Schritt 1: Wählen Sie Ihren Business Case
Da das Ziel von Content Marketing die Messung von Geschäftsergebnissen ist, müssen Sie zunächst definieren, was Sie zu erreichen hoffen.
- Markenbekanntheit: Wollen Sie Ihre Markenbekanntheit steigern und die Erstellung von Inhalten nutzen, um potenziellen Kunden den Weg zu Ihrer Website zu ebnen? Oder sind Sie daran interessiert, die Gesundheit Ihrer Marke zu verbessern, und möchten Inhalte erstellen, die die Art und Weise verändern, wie Ihr digitales Publikum Ihre Marke wahrnimmt?
- Conversions: Möchten Sie die Anzahl der Interessenten quantifizieren, die zu Kunden wurden, weil sie durch Ihre Inhalte eine Beziehung zu Ihnen aufgebaut haben? Möchten Sie die Anzahl der Leads erhöhen, für die Ihre Content Marketingstrategie verantwortlich ist?
- Loyalität: Wollen Sie bestehende Kunden durch die Erstellung von Inhalten ansprechen und informieren, mit dem Ziel, sie zu binden?
Schritt 2: Bestimmen Sie die KPIs zur Messung Ihres Business Case
In dieser Tabelle finden Sie die KPIs, die mit den einzelnen Geschäftszielen übereinstimmen.
1. Bezahlte vs. organische Suche Traffic
Die meisten Vermarkter haben Erfahrungen mit der bezahlten Suche und kennen deren Vor- und Nachteile.
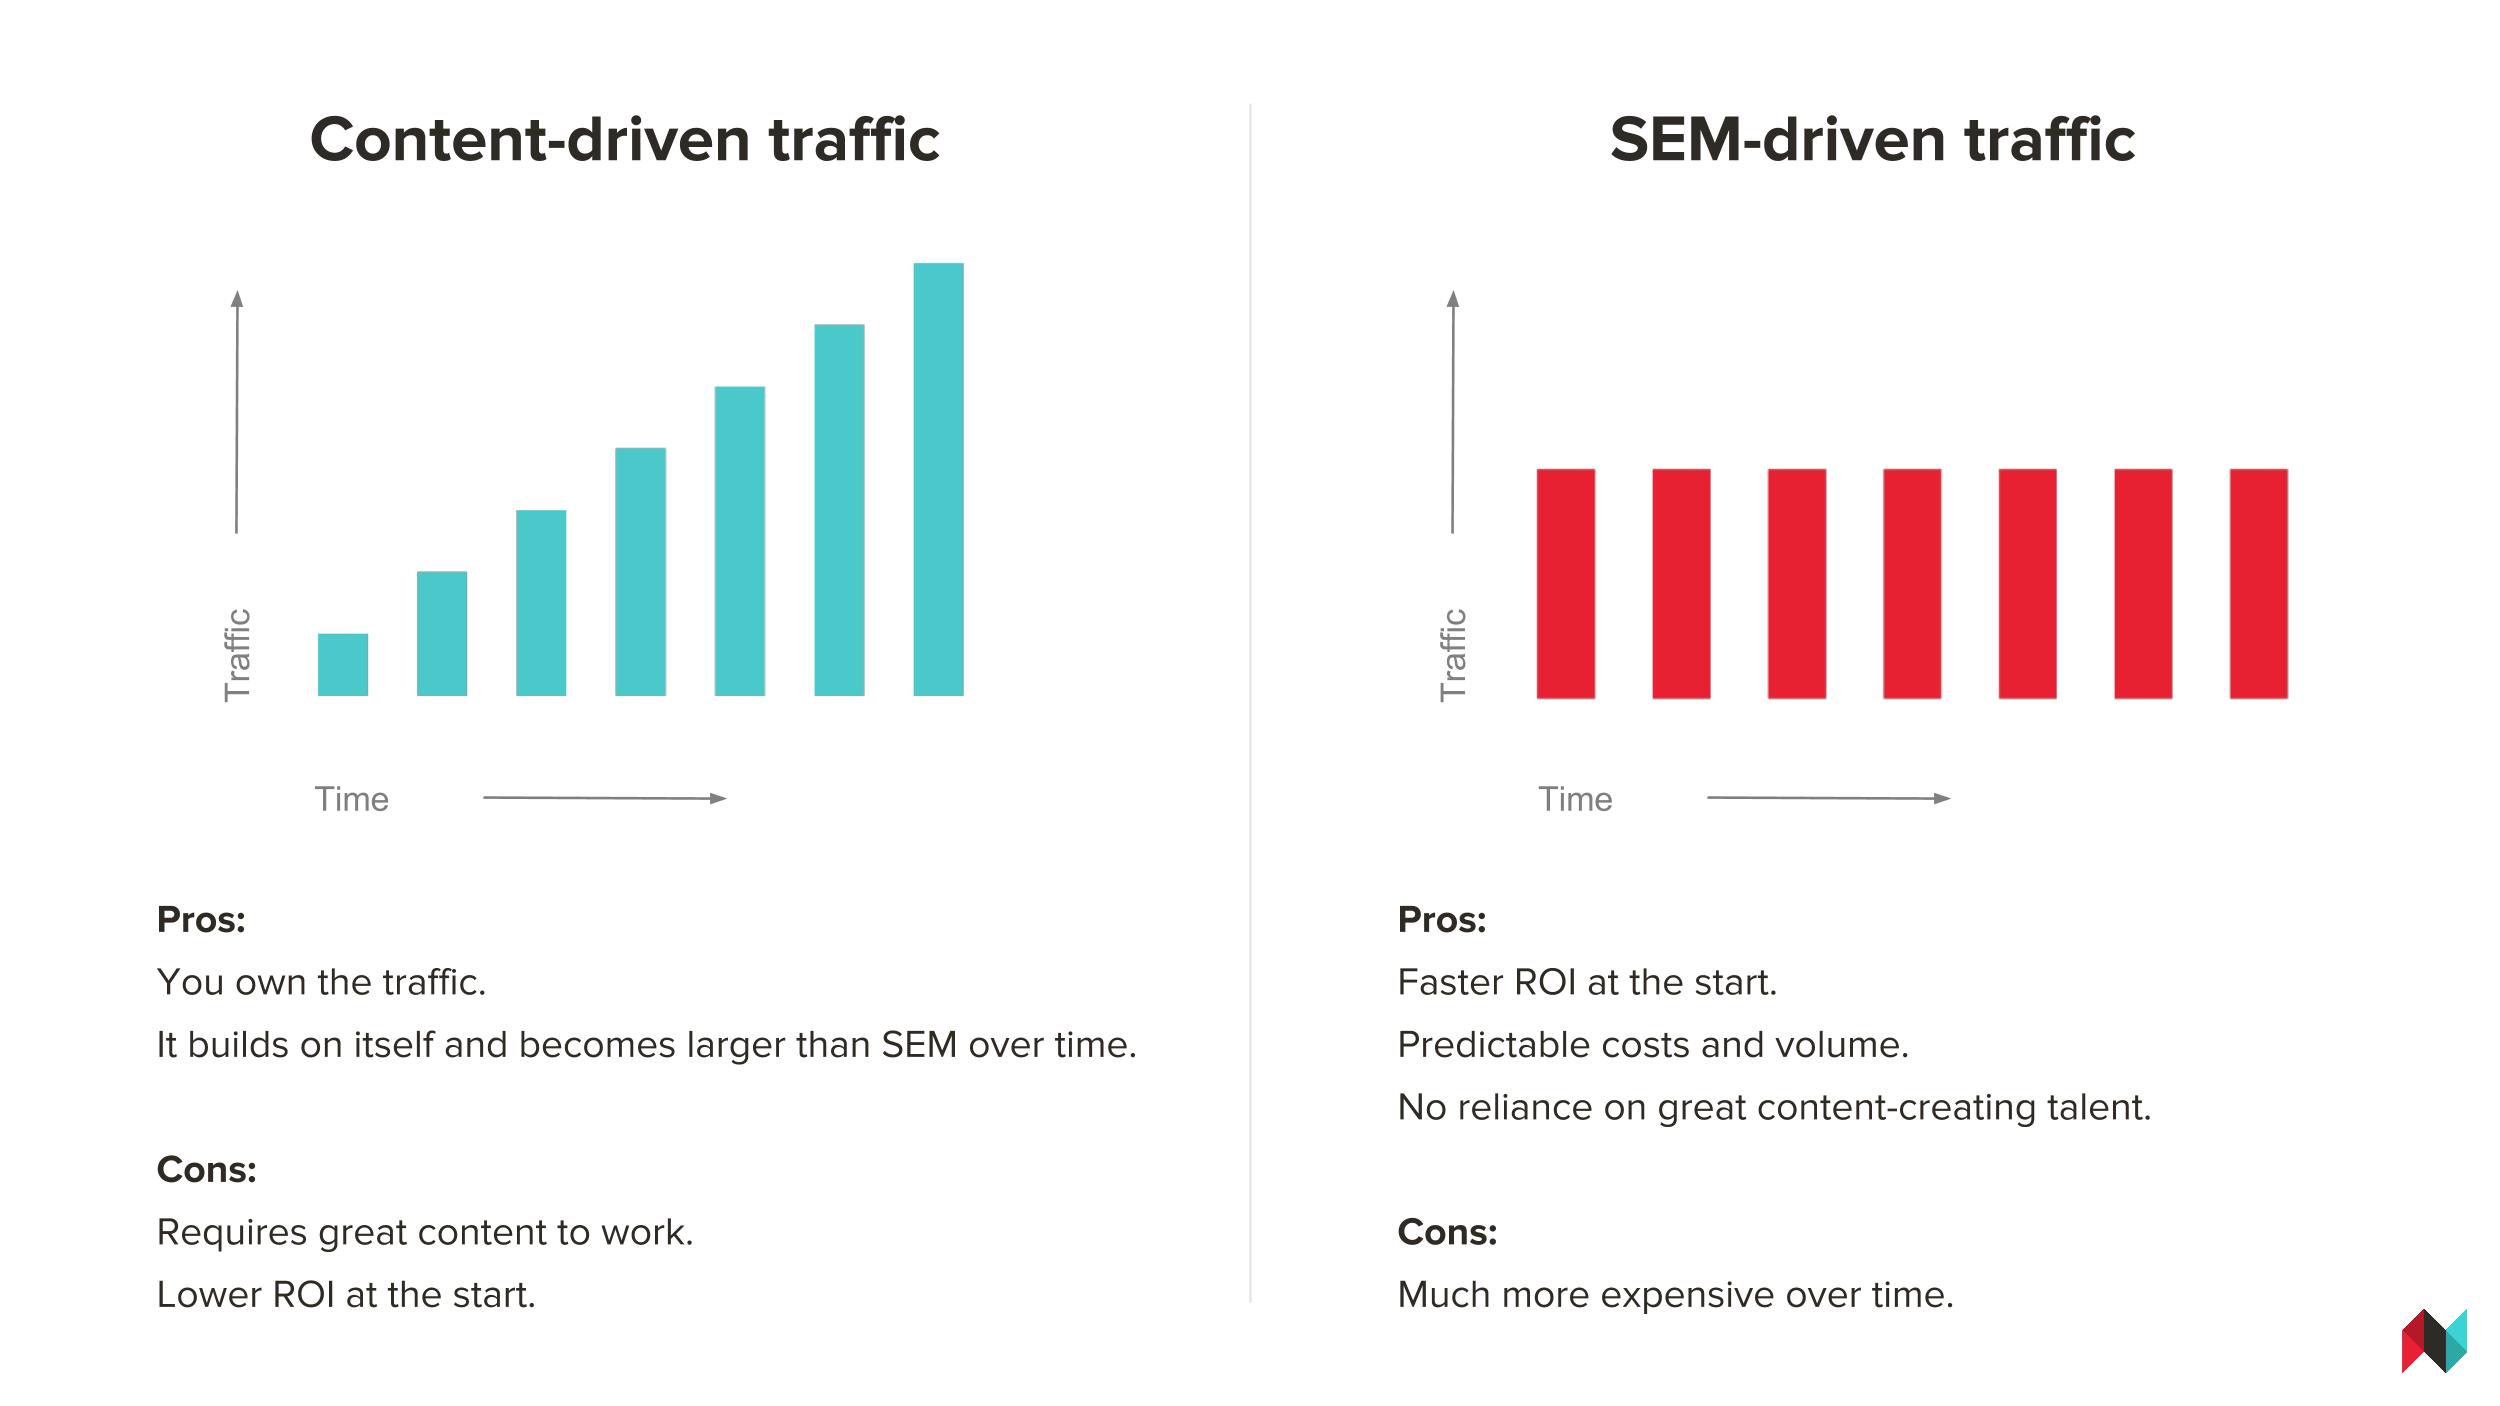
Der Vorteil ist, dass die bezahlte Suche schnell Ergebnisse liefert. Sobald Sie eine Kampagne für Suchmaschinenmarketing (SEM) gestartet haben, sehen Sie den Ertrag fast sofort. Sie können Ihren ROI auf der Grundlage Ihrer Ausgaben leicht vorhersagen. Und Sie werden immer Ergebnisse sehen - unabhängig davon, wie toll oder mittelmäßig Ihre Inhalte sind.
Sie müssen sich also nicht auf eine teure Agentur verlassen, um regelmäßig Artikel, Videos oder Infografiken zu verwalten. Es gibt eine Vielzahl von Content Marketing Platforms, die diese Aufgabe für Sie übernehmen können.
Die Kehrseite der Medaille: Der SEM-Verkehr ist nur so nachhaltig, wie das Geld, das Sie dafür ausgeben - Ihr Verkehr wird in dem Moment abnehmen, in dem Sie Ihre Ausgaben reduzieren.
Daher wird SEM mit der Zeit sehr kostspielig, da die Vermarkter die Maschine immer weiter füttern.
Content Marketing hingegen ist ein langfristiges Spiel. Es hat einen sich verstärkenden Effekt, aber das bedeutet, dass es Monate dauern wird, bis Sie den wahren ROI des Content Marketings in Ihrer SEO-Stärke sehen.
Im Gegensatz zu SEM erfordert Content Marketing eine erhebliche Vorabinvestition. Sie müssen Zeit aufwenden, um hochwertige Inhalte zu erstellen (z.B. lange Artikel, Erklärvideos, Blogging, Werbung über soziale Medienkanäle wie LinkedIn usw.), die die Aufmerksamkeit Ihres Publikums erregen.
Sobald Sie die Inhalte veröffentlicht haben, werden Sie einige Ergebnisse sehen, aber der wahre Erfolg wird sich erst Monate später einstellen.
Blog-Inhalte, die auf Ihre Zielgruppe zugeschnitten sind, bringen organischen Traffic, der mit den Klicks konkurriert, für die Sie über AdWords bezahlen müssen, und das zu einem Bruchteil der Kosten.
Wenn die Inhalte, die Sie produzieren, die sind, nach denen Ihre Zielgruppe sucht, wird sich der Effekt mit der Zeit verstärken.
Sie können den ROI Ihrer Inhalte auch durch Backlinks messen. Seriöse Sites, die auf Ihre Inhalte verlinken, sind nach wie vor ein wichtiger Ranking-Faktor.
Und das Beste daran ist, dass das alles Ihnen gehört.
Wie Sie bezahlten im Vergleich zu organischem Such-Traffic messen:
Wenn Sie für ein Thema einen hohen Rang einnehmen, finden Sie heraus, was Sie für AdWords ausgeben müssten, um die gleiche Menge an SEM-Traffic für dieses Thema zu erhalten.
Vergleichen Sie die Ausgaben mit dem Such-Traffic, den Ihre Site durch bezahlte Suchanzeigen erhält, im Vergleich zum Traffic, der durch ein hohes organisches Such-Ranking entsteht.
Hier ist ein Beispiel, um den Punkt zu verdeutlichen:
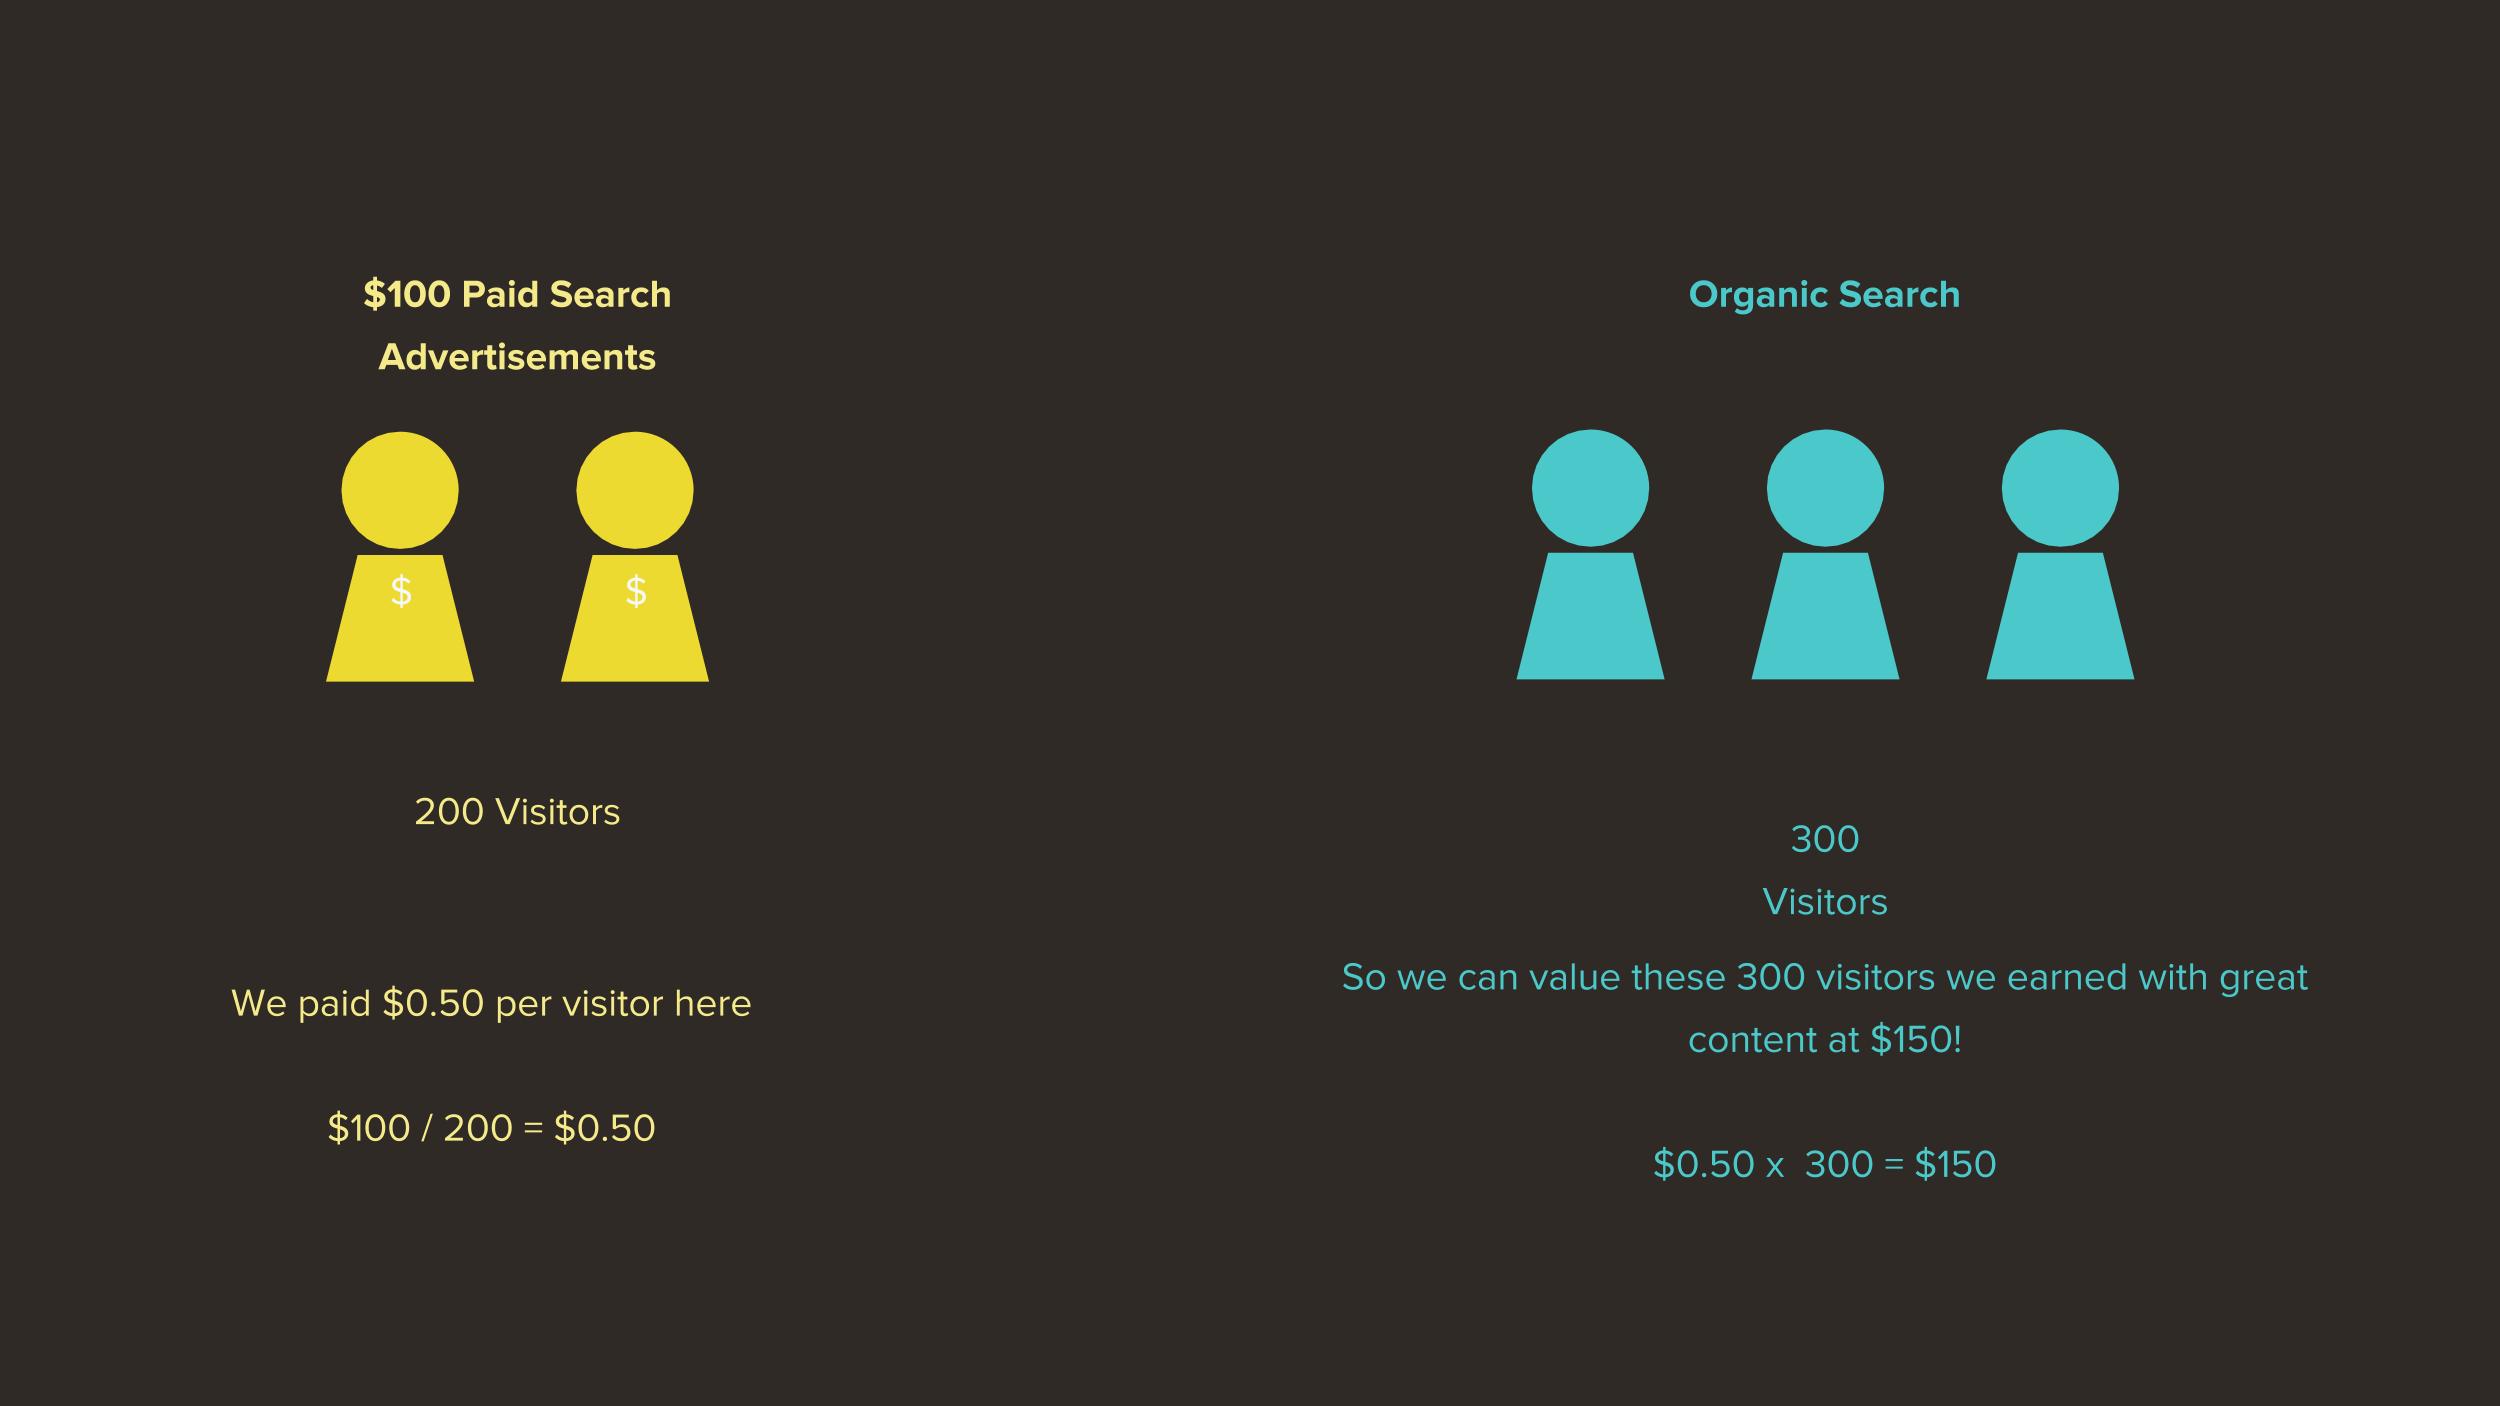
Nehmen wir an, eine Fluggesellschaft - nennen wir sie "Cloud City Air" - hat 100 $ für bezahlte Suchanzeigen zum Begriff "Cloud City Air Strandziele" ausgegeben und als Ergebnis dieser Ausgaben 200 Besucher erhalten. Jeder Besucher kostete die Fluggesellschaft also $.50.
Zum Vergleich: Nehmen wir an, die Fluggesellschaft erhielt auch 300 Besucher über die organische Suche nach "Cloud City Air Strandziele" - weil sie eine hoch gerankte SEO Landing Page mit tollen Artikeln, schönen Bildern und Reiseangeboten für sonnige Urlaube hatte.
Diese Besucher kosteten die Fluggesellschaft 0 $ an Suchanzeigen. Aber die Fluggesellschaft könnte diese Besucher auf der Grundlage ihrer bezahlten Suchausgaben mit $150 bewerten.
2. Ungebrandeter bezahlter vs. ungebrandeter organischer Suche Traffic
Vergleichen Sie auf genau dieselbe Weise Ihren nicht markengebundenen bezahlten Traffic mit Ihrem nicht markengebundenen organischen Search Traffic.
Jeder Besucher, der nach Ihrem Markennamen sucht, weiß bereits, wohin er gehen möchte. (Wer zum Beispiel nach "Welcome Software" oder "Welcome Insights" sucht, möchte mit uns in Kontakt treten.)
Es ist wichtig, den nicht markengebundenen organischen Traffic zu berechnen, damit Sie etwas über die Besucher erfahren, die nicht wussten, wo sie landen würden.
Sie hatten eine Frage, fragten eine Suchmaschine nach dem Weg, und diese Interaktion führte sie zu Ihnen. (Manche Menschen kommen beispielsweise zu Welcome, nachdem sie "Content Marketing Unternehmen" oder "Content Marketing Software" gegoogelt haben.)
Wenn Sie sehen, wie gut Sie bei diesen nicht markengebundenen organischen Suchbegriffen ranken, haben Sie ein besseres Gefühl dafür, wie viel Sie an SEM-Dollars einsparen.
3. Social Media Shares + Follower
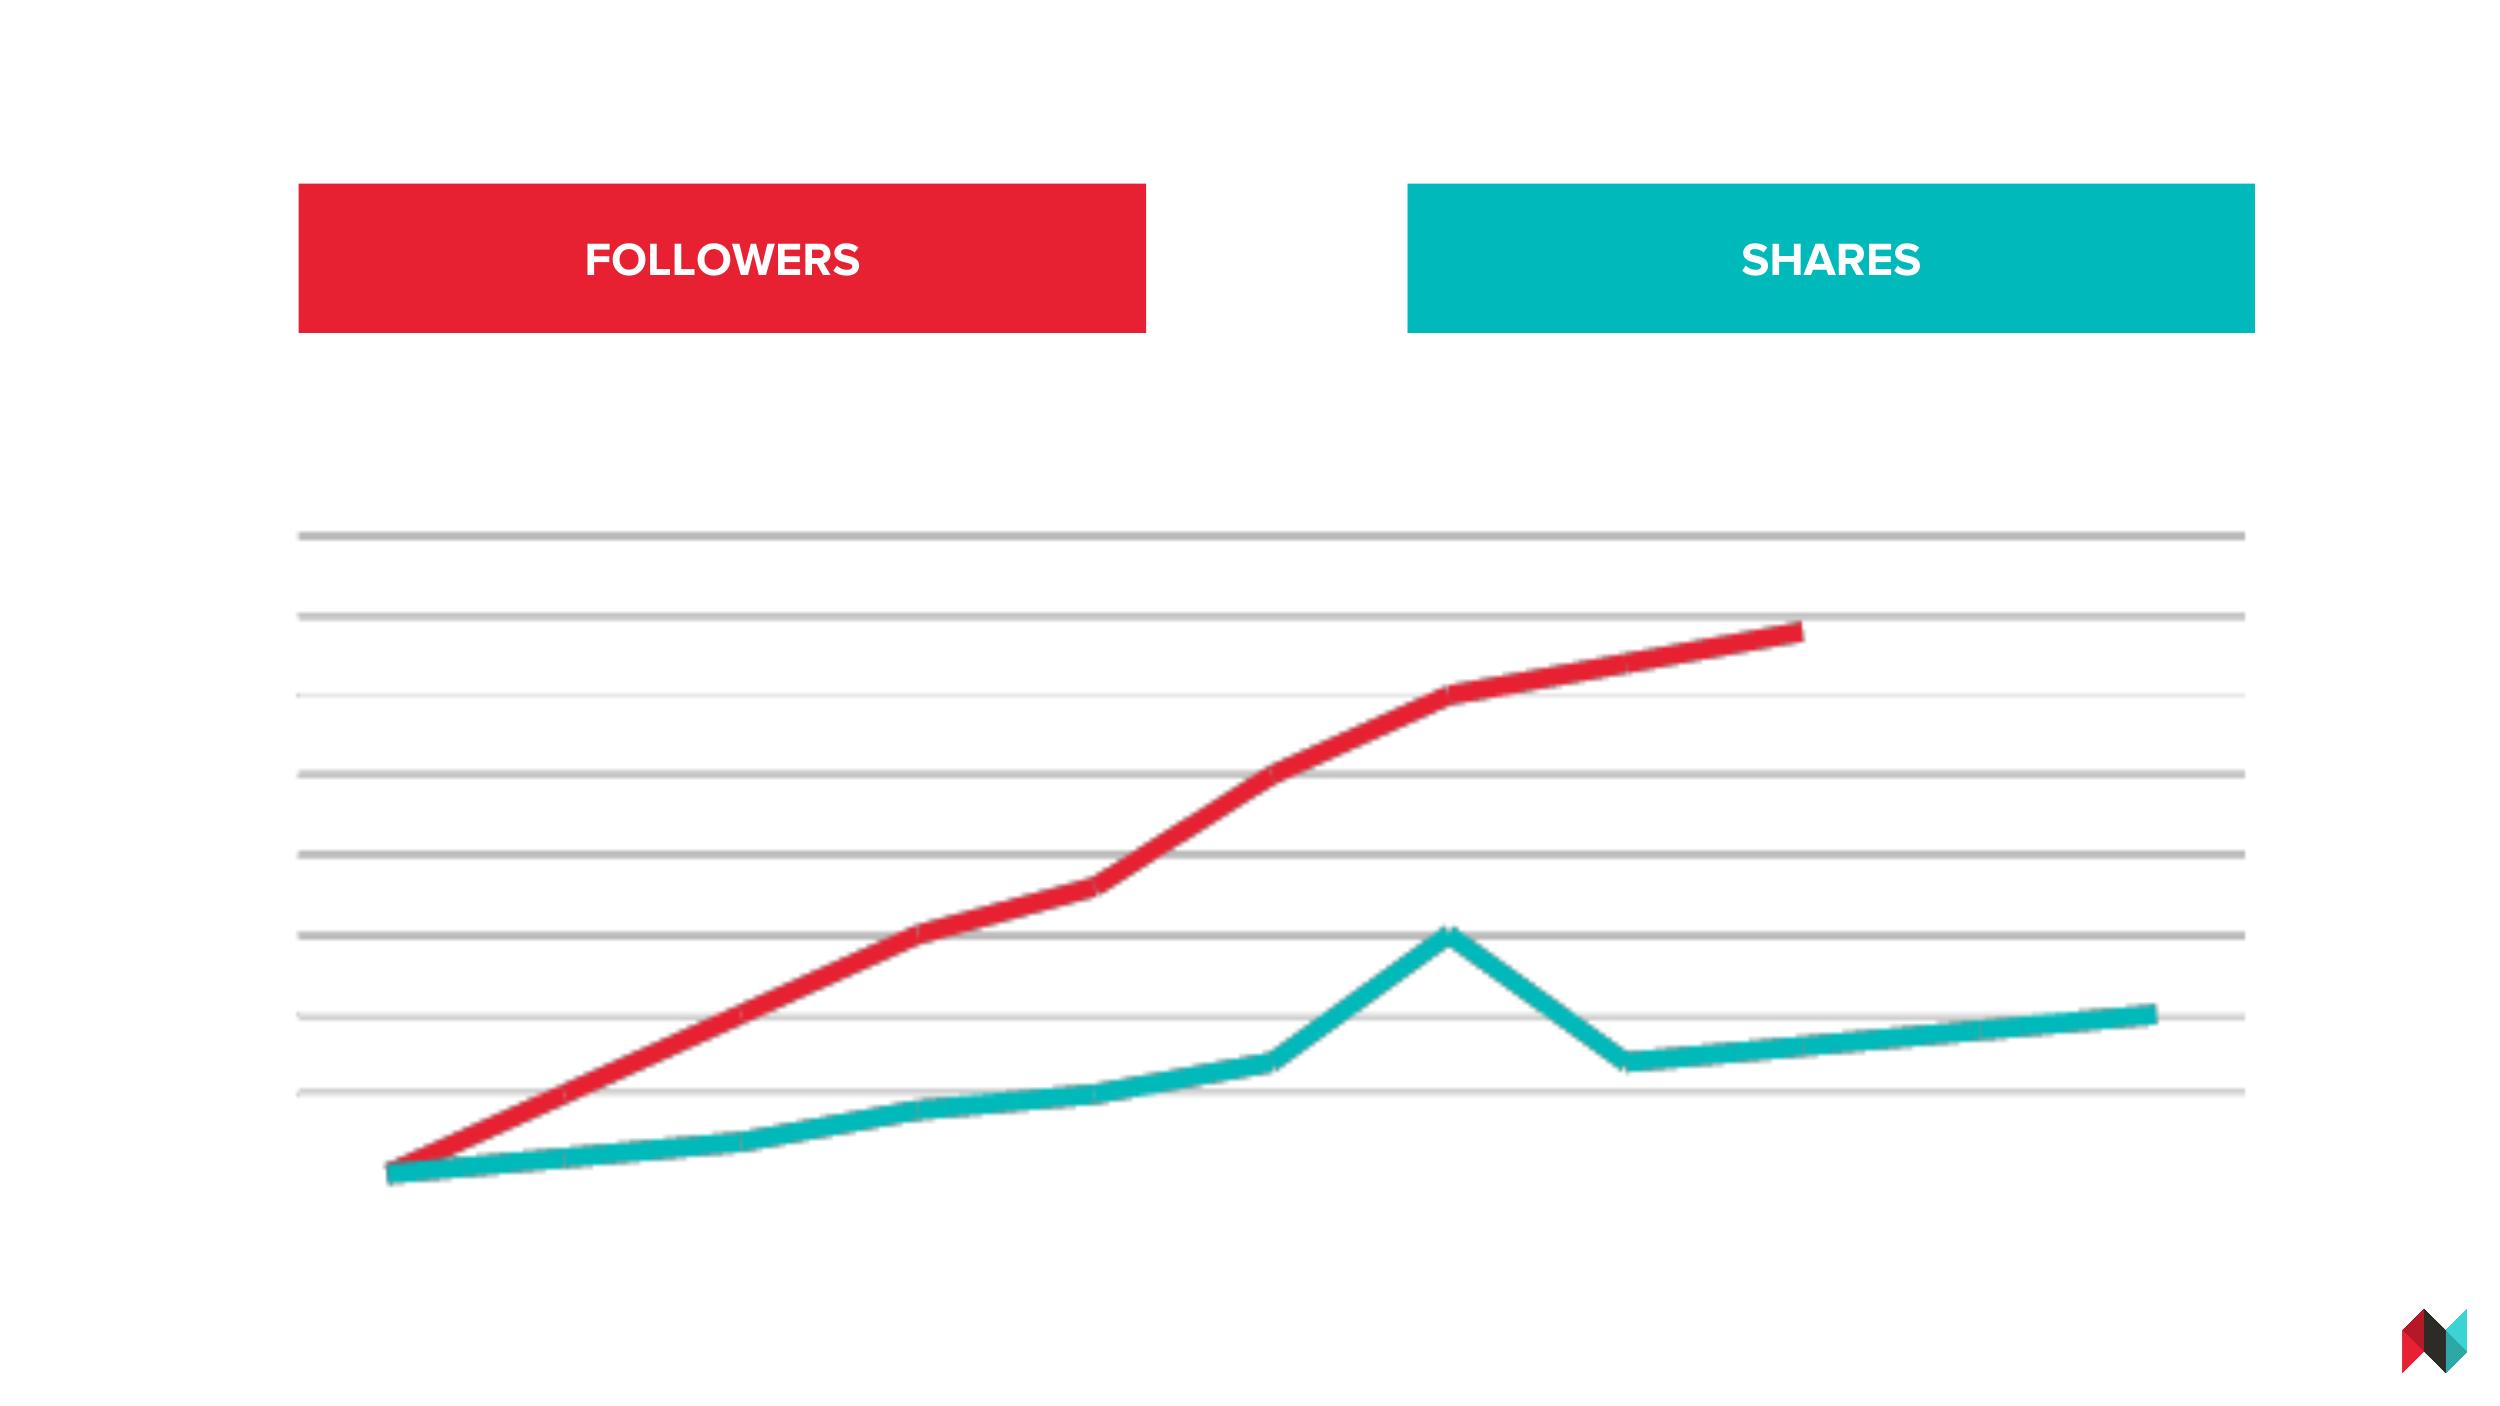
Marken sollten auch das Wachstum ihrer Follower in den sozialen Medien mit der Gesamtzahl ihrer Shares vergleichen.
B2B-Vermarkter sind oft von der letzteren Zahl begeistert, aber die wertvollere Kennzahl ist die Zunahme des Publikums in den sozialen Medien.
Dies sind Menschen, die sich für zukünftige Inhalte Ihrer Marke entscheiden. Wenn beides zunimmt, deutet dies darauf hin, dass Ihre organischen Social Shares das richtige Publikum erreichen - und es bei diesen neuen Menschen aufbauen.
Optimizely is a 8x Leader in CMPs!
4. Share of Voice
Der Share of Voice misst im Wesentlichen, wie viel über Ihre Marke oder Ihr Produkt im Vergleich zu Ihren Wettbewerbern zu einem bestimmten Thema gesprochen wird.
Wenn Sie nicht mit einem Tool oder einer Agentur arbeiten, die den Share of Voice berechnet, können Sie Google Alerts einrichten, um Ihre Erwähnungen im Vergleich zu denen Ihrer Konkurrenten zu verfolgen und Ihre PR-Treffer in wichtigen Publikationen zu zählen.
Darüber hinaus können Sie auch Social Tracker verwenden, um den Umfang der Konversation über Ihre Marke im Vergleich zu Ihren Konkurrenten zu messen.
Geschäftsziel: Markengesundheit
Wenn die Gesundheit Ihrer Marke Ihr Ziel ist, messen Sie, wie Ihr Publikum über Sie denkt.
KPI-Benchmarks zum Messen:
- Wiederkehrende Besucher
- Abonnenten
- Soziale Likes + Follower
- Offsite-SEO
- Seitenaufrufe
- Click-Through-Rate (CTR)
- Aufgerufene Artikel
- Engagement-Rate
- Durchschnittliche Verweildauer
- Bounce-Rate (Absprungrate)
Wahrscheinlich sind Sie mit diesen Metriken sehr vertraut, daher werden wir bei den ersten sieben nicht weiter ins Detail gehen.
Wenn Sie sie messen, ist es wichtig, dass Sie dies unter dem Gesichtspunkt des Beziehungsaufbaus tun - d.h., dass Sie Menschen anziehen, die Ihrer Marke treu bleiben und sie immer im Blick haben.
Denken Sie daran, dass 96% der Besucher Ihrer Site noch nicht bereit sind, bei Ihnen zu kaufen, so Social Media Today, 2014.
Sie müssen sich also kreative Wege einfallen lassen, um potenzielle Kunden immer wieder auf Ihre Site zurückzubringen, damit sie sich für Sie entscheiden, wenn sie zum Kauf bereit sind.
Wir werden uns jedoch die durchschnittliche Verweildauer genauer ansehen. Ihr Verhältnis zwischen der Verweildauer auf der Site und den Seitenaufrufen kann verschiedene Bedeutungen haben:
Überlegen Sie bei der Festlegung Ihres Ziels für die durchschnittliche Verweildauer, welches Ziel sich am besten mit Ihrem größeren Unternehmensziel vereinbaren lässt.
Geschäftsziel: Conversions
Zu messende KPIs:
- Kosten pro Lead, Verkaufschance, Geschäft
- Gesamte Conversions/E-Commerce Checkouts
- Prozentualer Anteil der Leads, die durch Content Marketing zustande gekommen sind
Werfen wir einen Blick darauf, wie wir Content Marketing betreiben.
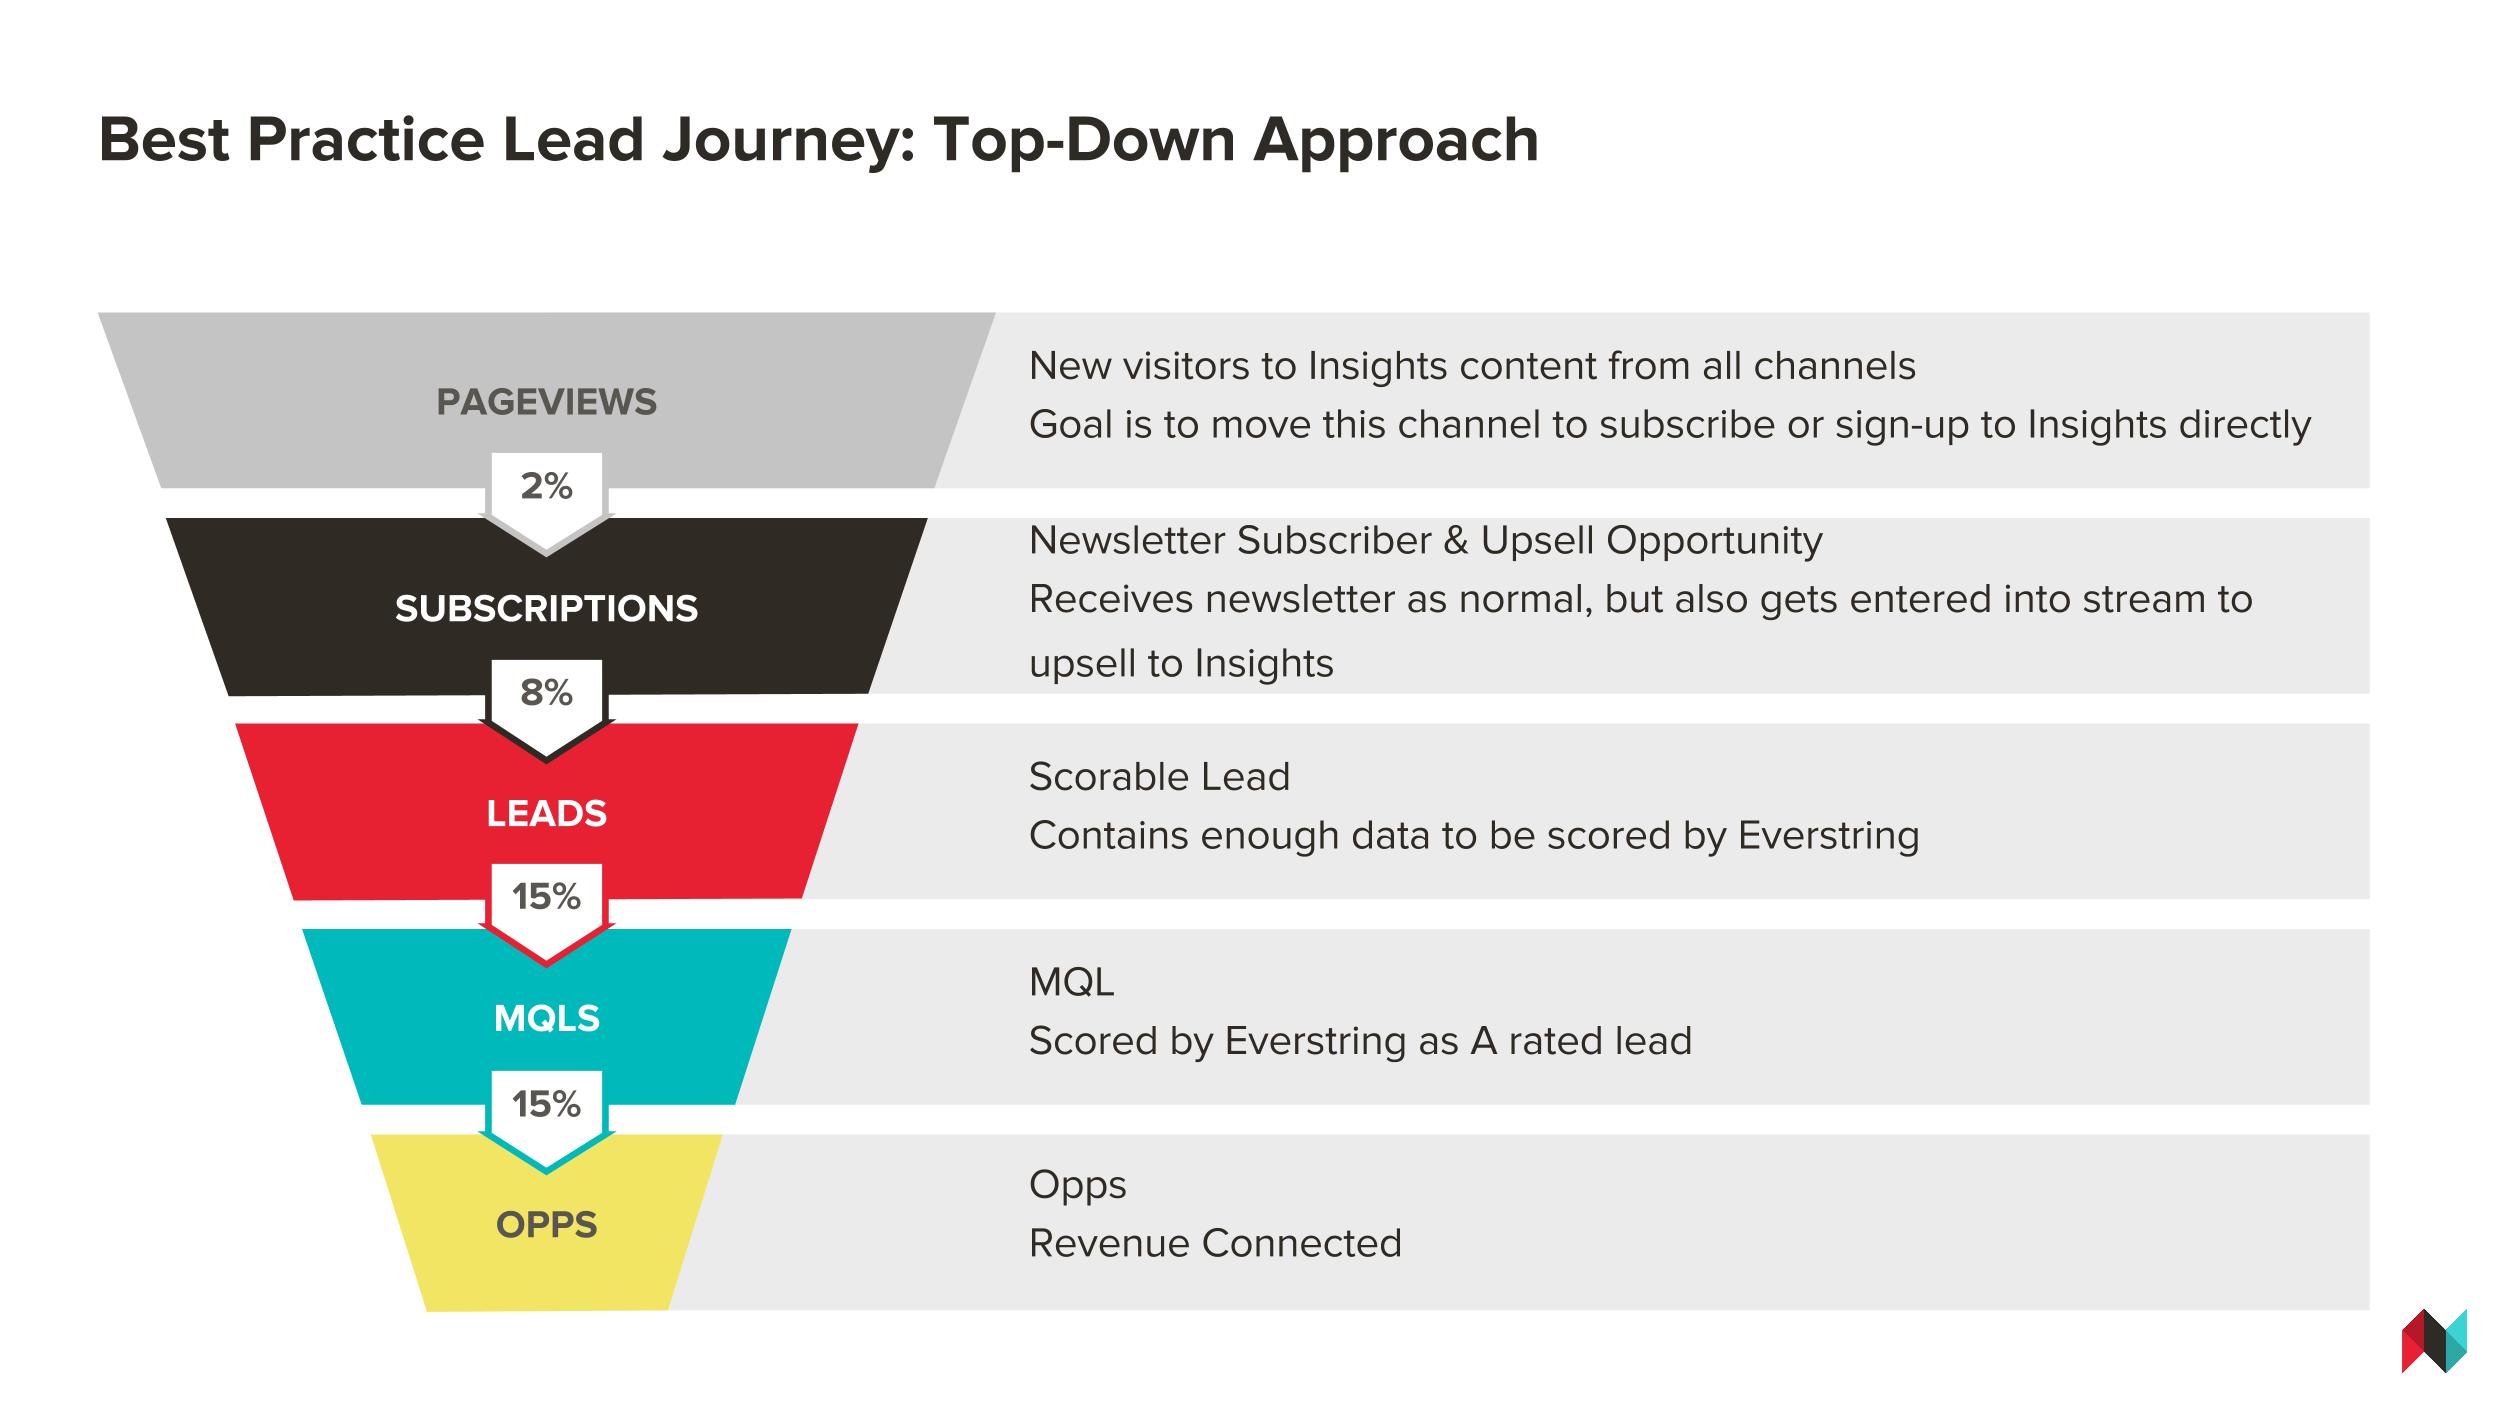
Wenn wir bei Welcome über Conversions nachdenken - ein wichtiger KPI, mit dem wir unseren Einfluss auf den Umsatz nachweisen können -, betrachten wir die Conversions in unserem gesamten Sales-Funnel.
Wir beginnen mit der Frage nach der Absicht: Ergreifen die Kunden Maßnahmen, die darauf hindeuten, dass sie eine Beziehung zu uns aufbauen möchten?
Wechseln sie zum Beispiel von unserem Insights-Blog zu unserer Hauptdomain oder andersherum?
Oder laden sie im Laufe der Zeit wiederholt unsere Inhalte herunter oder beschäftigen sich mit ihnen?

Dann schauen wir uns an, wie sie sich entscheiden, sich auf einer tieferen Ebene mit uns zu beschäftigen.
Wir zählen zum Beispiel Newsletter-Abonnements nicht als Leads. Stattdessen verlangen wir von den Abonnenten, dass sie ein zusätzliches Formular ausfüllen, in dem sie weitere Informationen zu ihrer Person (einschließlich Berufsbezeichnung und Unternehmen) angeben.
Auf diese Weise können wir unsere Leads bewerten und sie im Laufe der Zeit mit weiteren Inhalten an uns binden: Newsletter, Webinare, Veranstaltungen.
Während dieses Prozesses messen wir auch die Relevanz. Wir arbeiten mit unseren Vertriebsteams zusammen, um unsere Definition eines Marketing Qualified Lead (MQL) abzustimmen und sicherzustellen, dass diese Personen für unser Vertriebsteam von Bedeutung sind.
Und wir bewerten, wie unser Content Marketing-Kanal im Vergleich zu unseren anderen Kanälen abschneidet und wie er mit Events, AdWords, Outbound-Vertrieb und Empfehlungen zusammenarbeitet bzw. im Vergleich dazu abschneidet.
Wir sehen uns die Anzahl der abgeschlossenen Geschäfte an und vergleichen die Kosten pro Verkaufschance und Geschäft mit unseren anderen Kanälen. Der Trick besteht darin, zu messen, wie Content Marketing im Laufe der Zeit wächst und sich verbessert.
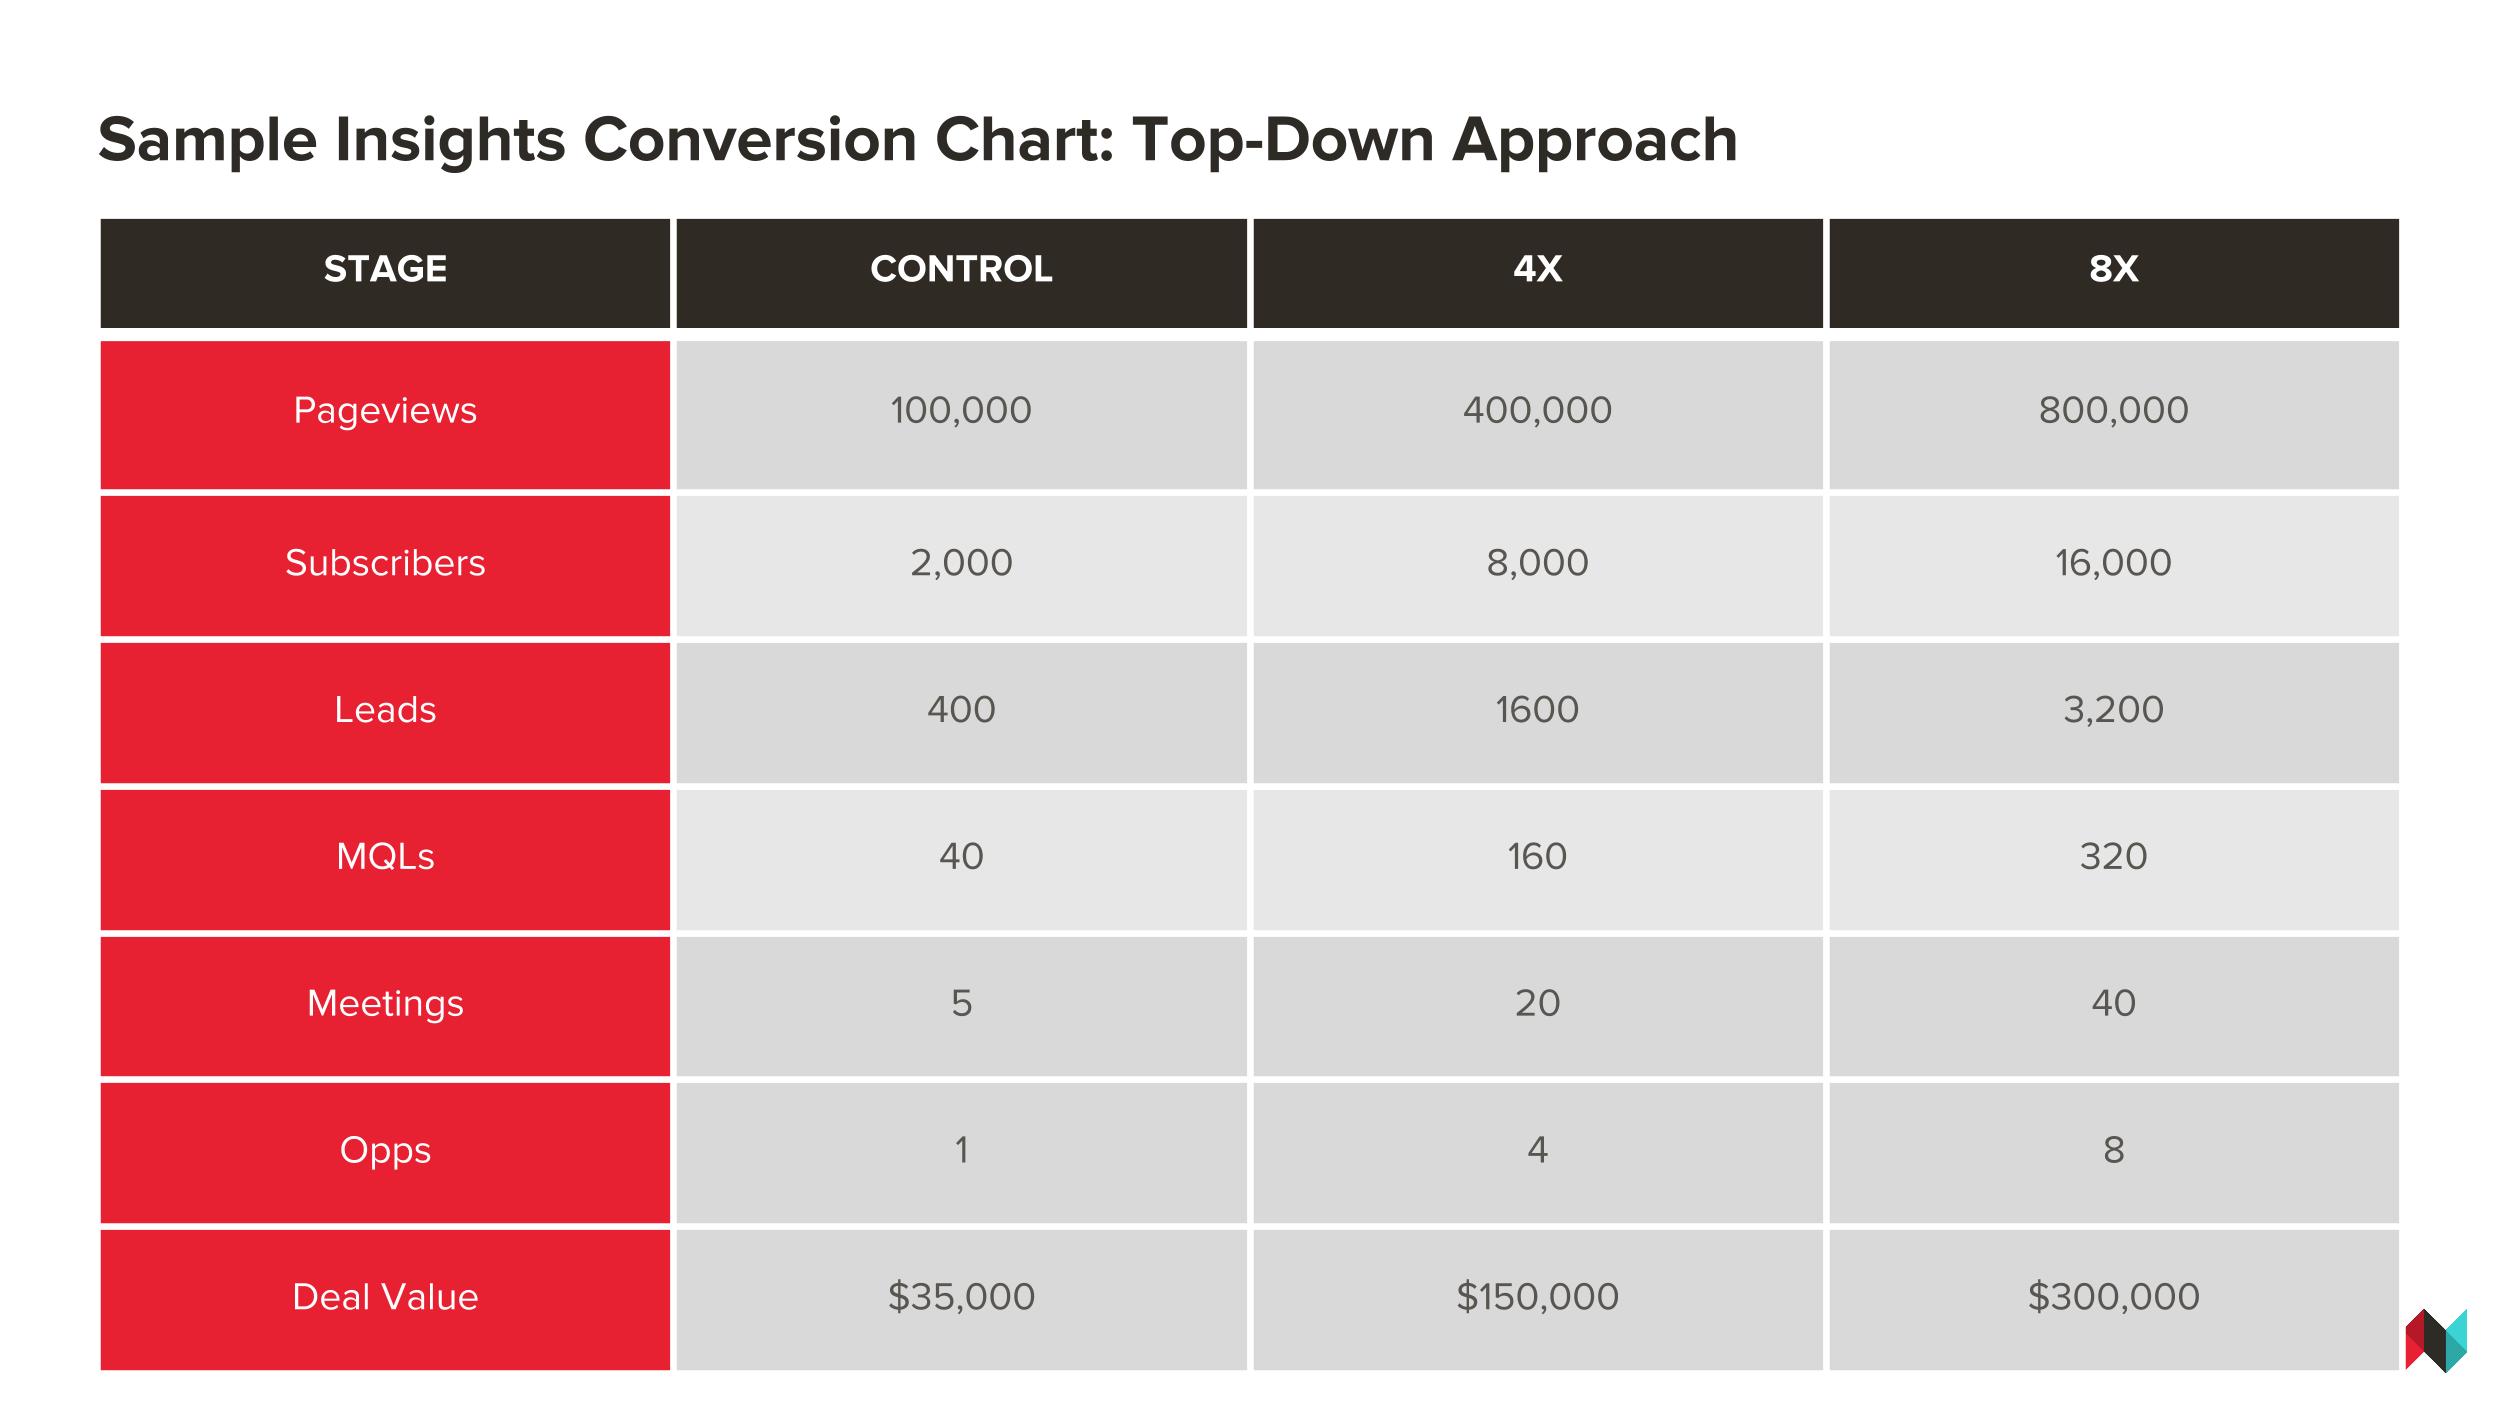
Wenn Sie über einen längeren Zeitraum genügend Daten haben, können Sie ein Prognosemodell erstellen und abschätzen, wie viel Sie im Vergleich zu Ihren Seitenaufrufen an Abschlüssen erwarten können.
Sie können auch einen Bottom-up-Ansatz zur Messung der Conversions wählen.
Diese Methode ist zwar manuell und zeitaufwändig, aber sie kann Ihnen einen guten Einblick in die Customer Journey der einzelnen Kunden geben.
Sie können sehen, welche Inhalte den Käufer dazu gebracht haben, weitere Maßnahmen zu ergreifen, bevor er schließlich konvertiert.
Sobald Sie zahlreiche Lead Journeys im Laufe der Zeit analysiert haben, können Sie erkennen, welche Inhalte bei der Pflege und Umwandlung von Leads am einflussreichsten waren.
Diese Daten können Sie als Grundlage für Ihre Content-Strategie verwenden. Der unten beschriebene Ansatz funktioniert, wenn Sie Marketo und Salesforce in Ihrem Marketing Stack haben, aber ein ähnliches Prinzip würde auch mit anderen Marketing Automation Tools funktionieren.
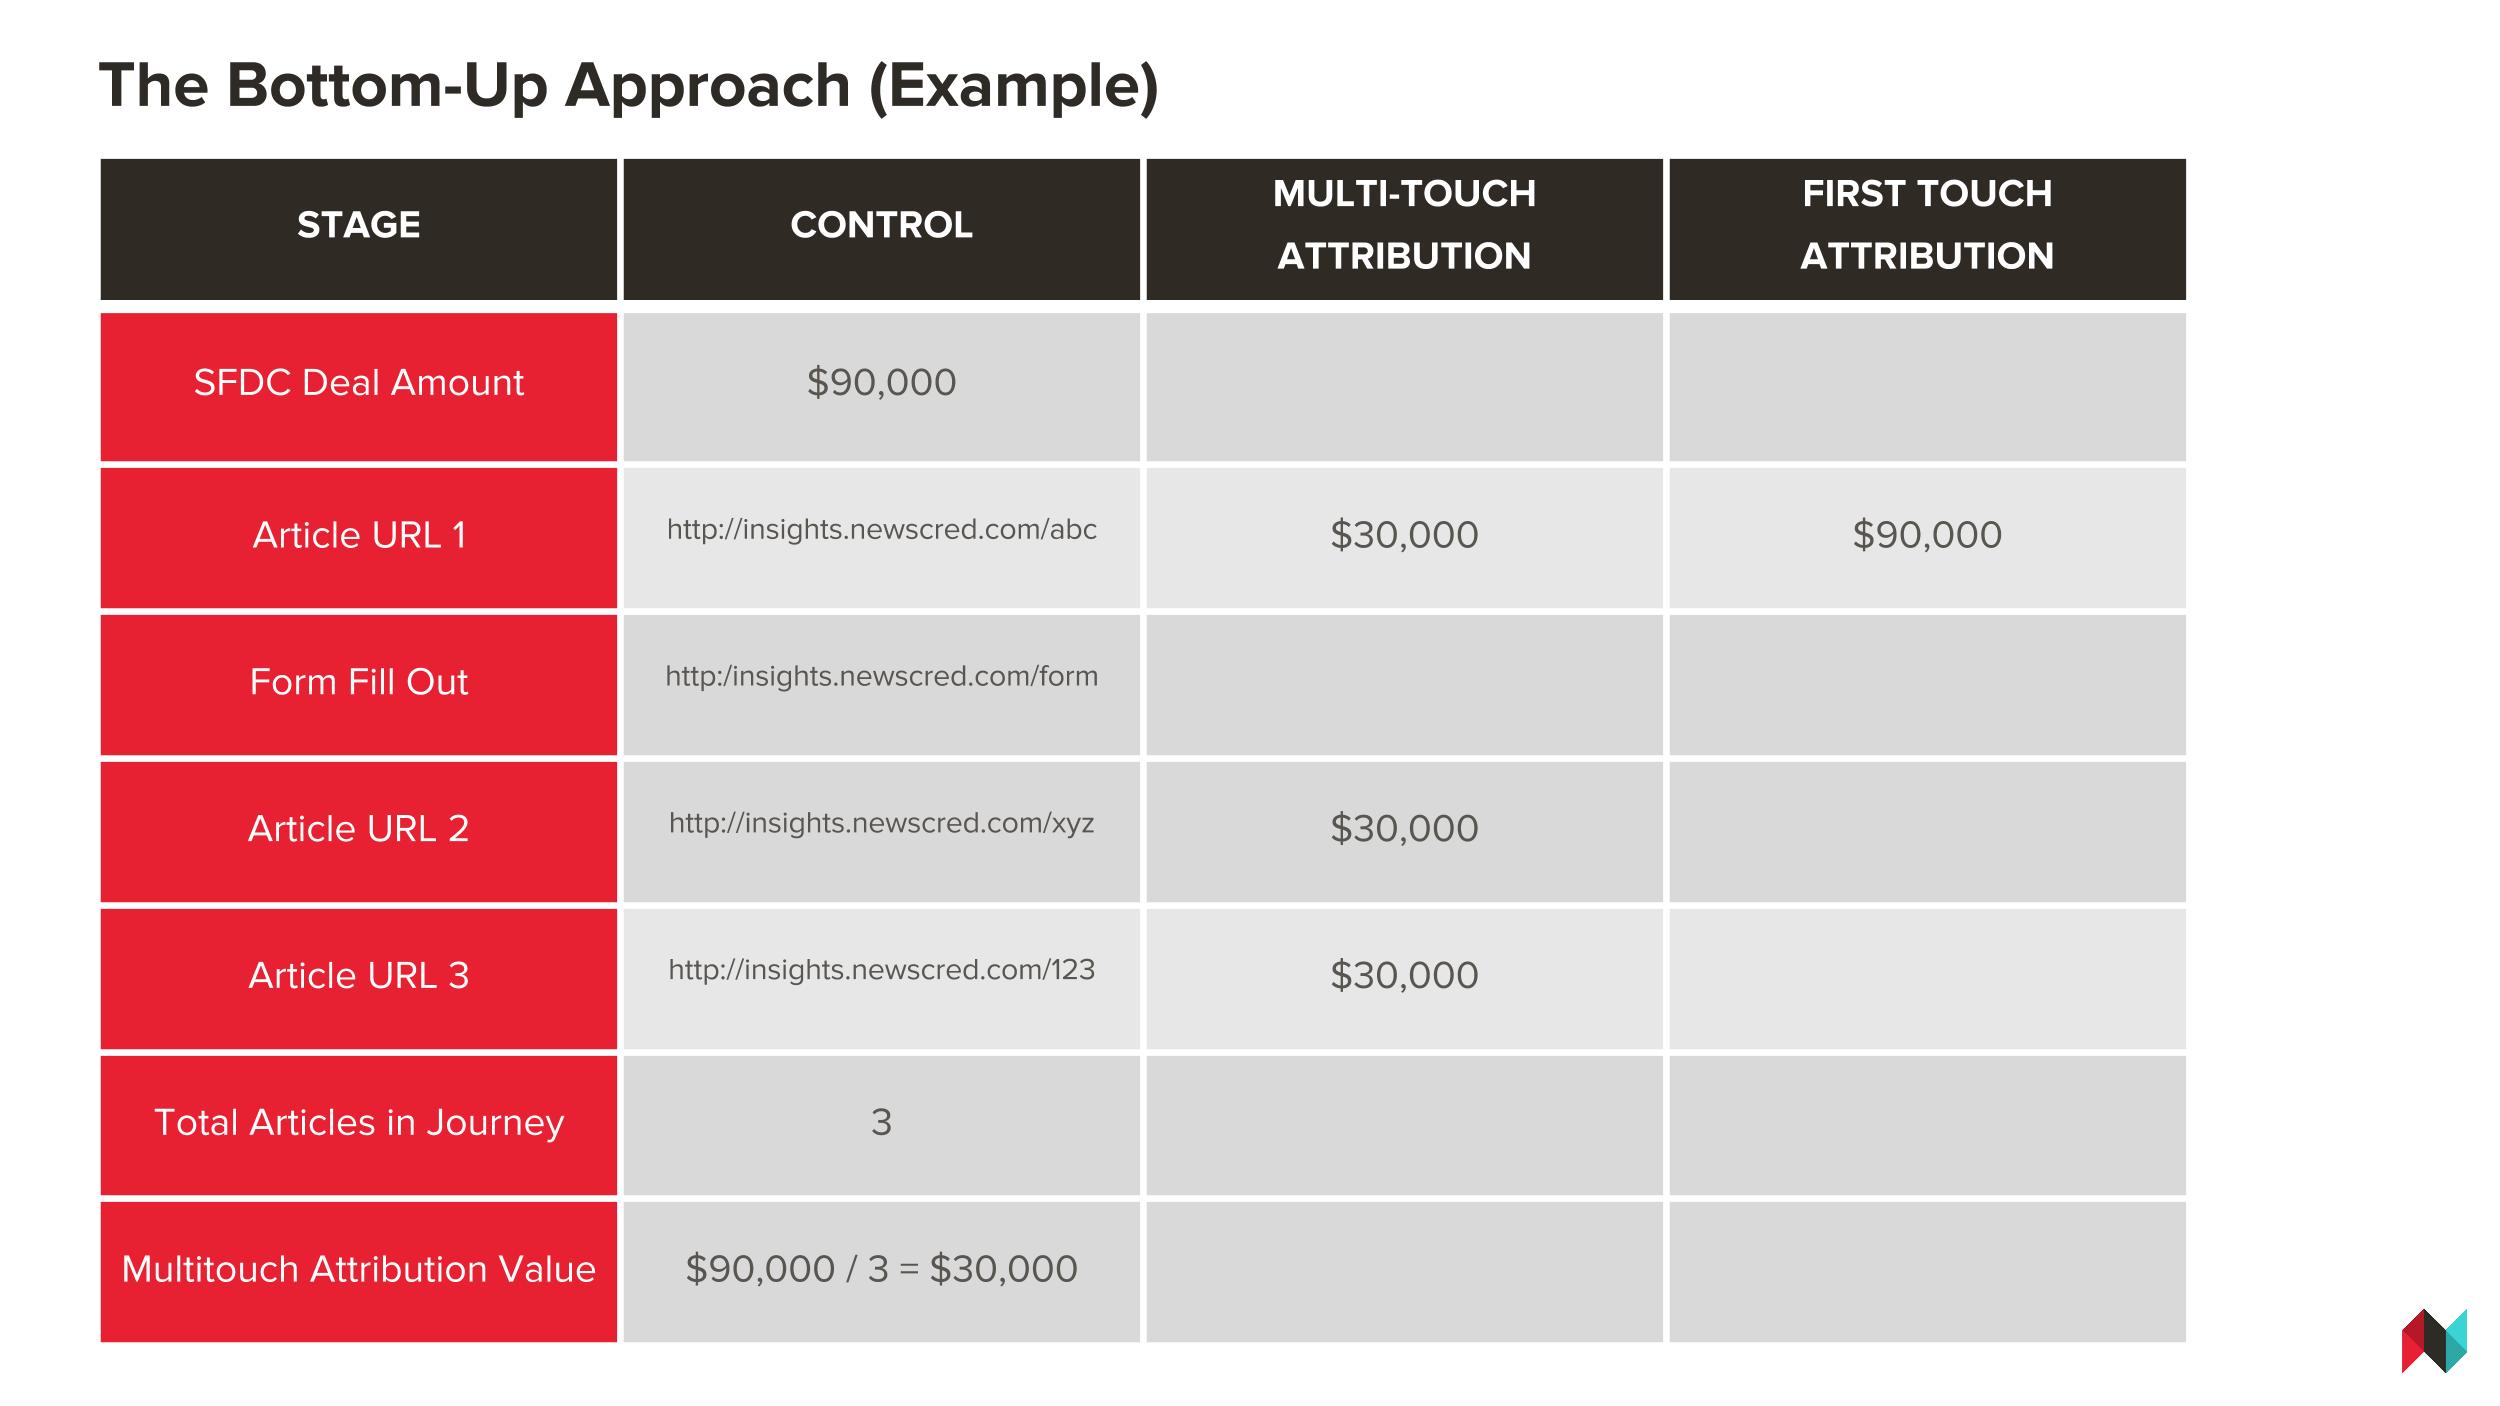
Hier sehen Sie einen schrittweisen Überblick über den Bottom-up-Prozess, den wir bei Welcome verwenden:
- Überprüfen Sie jedes Geschäft, das in Salesforce abgeschlossen wird, und notieren Sie für jedes Geschäft den erzielten Betrag.
- Suchen Sie den entsprechenden Lead in Ihrem CRM.
- Sehen Sie sich das Aktivitätsprotokoll des Leads an.
- Filtern Sie nach "Webseitenbesuche" (oder "Interessante Momente").
- Notieren Sie jeden Inhalt, der berührt wurde.
- Notieren Sie, ob die erste Berührung im Aktivitätsprotokoll ein Inhalt war.
- Nehmen Sie den Gesamtbetrag des Geschäfts aus Salesforce und teilen Sie ihn durch die Anzahl der berührten Inhalte.
- Weisen Sie den Betrag aus Schritt 7 jedem Inhalt zu gleichen Teilen zu. Dies ist Ihr Wert für die Multi-Touch-Attribution.
- Wenn die erste Berührung ein Inhalt war, ordnen Sie den Salesforce-Betrag in voller Höhe diesem Inhalt zu. Dies ist Ihr Wert für die Attribution der ersten Berührung.
(Haben Sie keine Lust, dies alles manuell zu tun? Mit der Content Marketing Software von Welcome können Sie die Content Journeys und die Auswirkungen der Inhalte auf Leads, Opportunities und Geschäfte verfolgen. Die Software kann Ihnen sogar den Dollarwert für jeden einzelnen Inhalt nennen).
Geschäftsziel: Loyalität und Bindung
Unternehmen können unglaubliche wirtschaftliche Vorteile genießen, wenn sie Kunden an sich binden.
"Vollständig engagierte" Kunden (Kunden mit einer starken Bindung an die Marke oder Markenbotschafter) bieten einen 23%igen Aufschlag auf den durchschnittlichen Kunden in Bezug auf den Anteil am Geldbeutel, die Rentabilität und den Umsatz.
Und eine Steigerung der Kundenbindung um 5% kann den Gewinn um bis zu 80% erhöhen.
Die Bindung von Kunden kann Ihren Gewinn auch aus folgenden Gründen steigern:
- Geringere Akquisitionskosten: Bestehende Kunden erfordern weniger Werbung und somit einen kleineren Außendienst.
- Umsatzwachstum bei Stammkunden: Kunden geben mit der Zeit mehr aus.
- Niedrigere Betriebskosten: Langfristige Kunden stellen weniger Anforderungen an Verwaltung und Service.
- Kundenempfehlungen: Loyale Kunden bringen die richtigen neuen Kunden und niedrige/keine Kosten.
- Hochwertige Preise: Zufriedene Kunden sind weniger preisempfindlich.
Leider sind Unternehmen nicht besonders gut darin, Kunden zu binden. Die meisten verlieren alle fünf Jahre 50% ihrer Kunden. Diese Untreue bremst das Unternehmenswachstum um 25% bis 50%.
Inhalte können eine wesentliche Rolle bei der Kundenbindung spielen. Die Loyalität der Kunden steigt mit der Häufigkeit Ihrer Interaktionen mit ihnen.
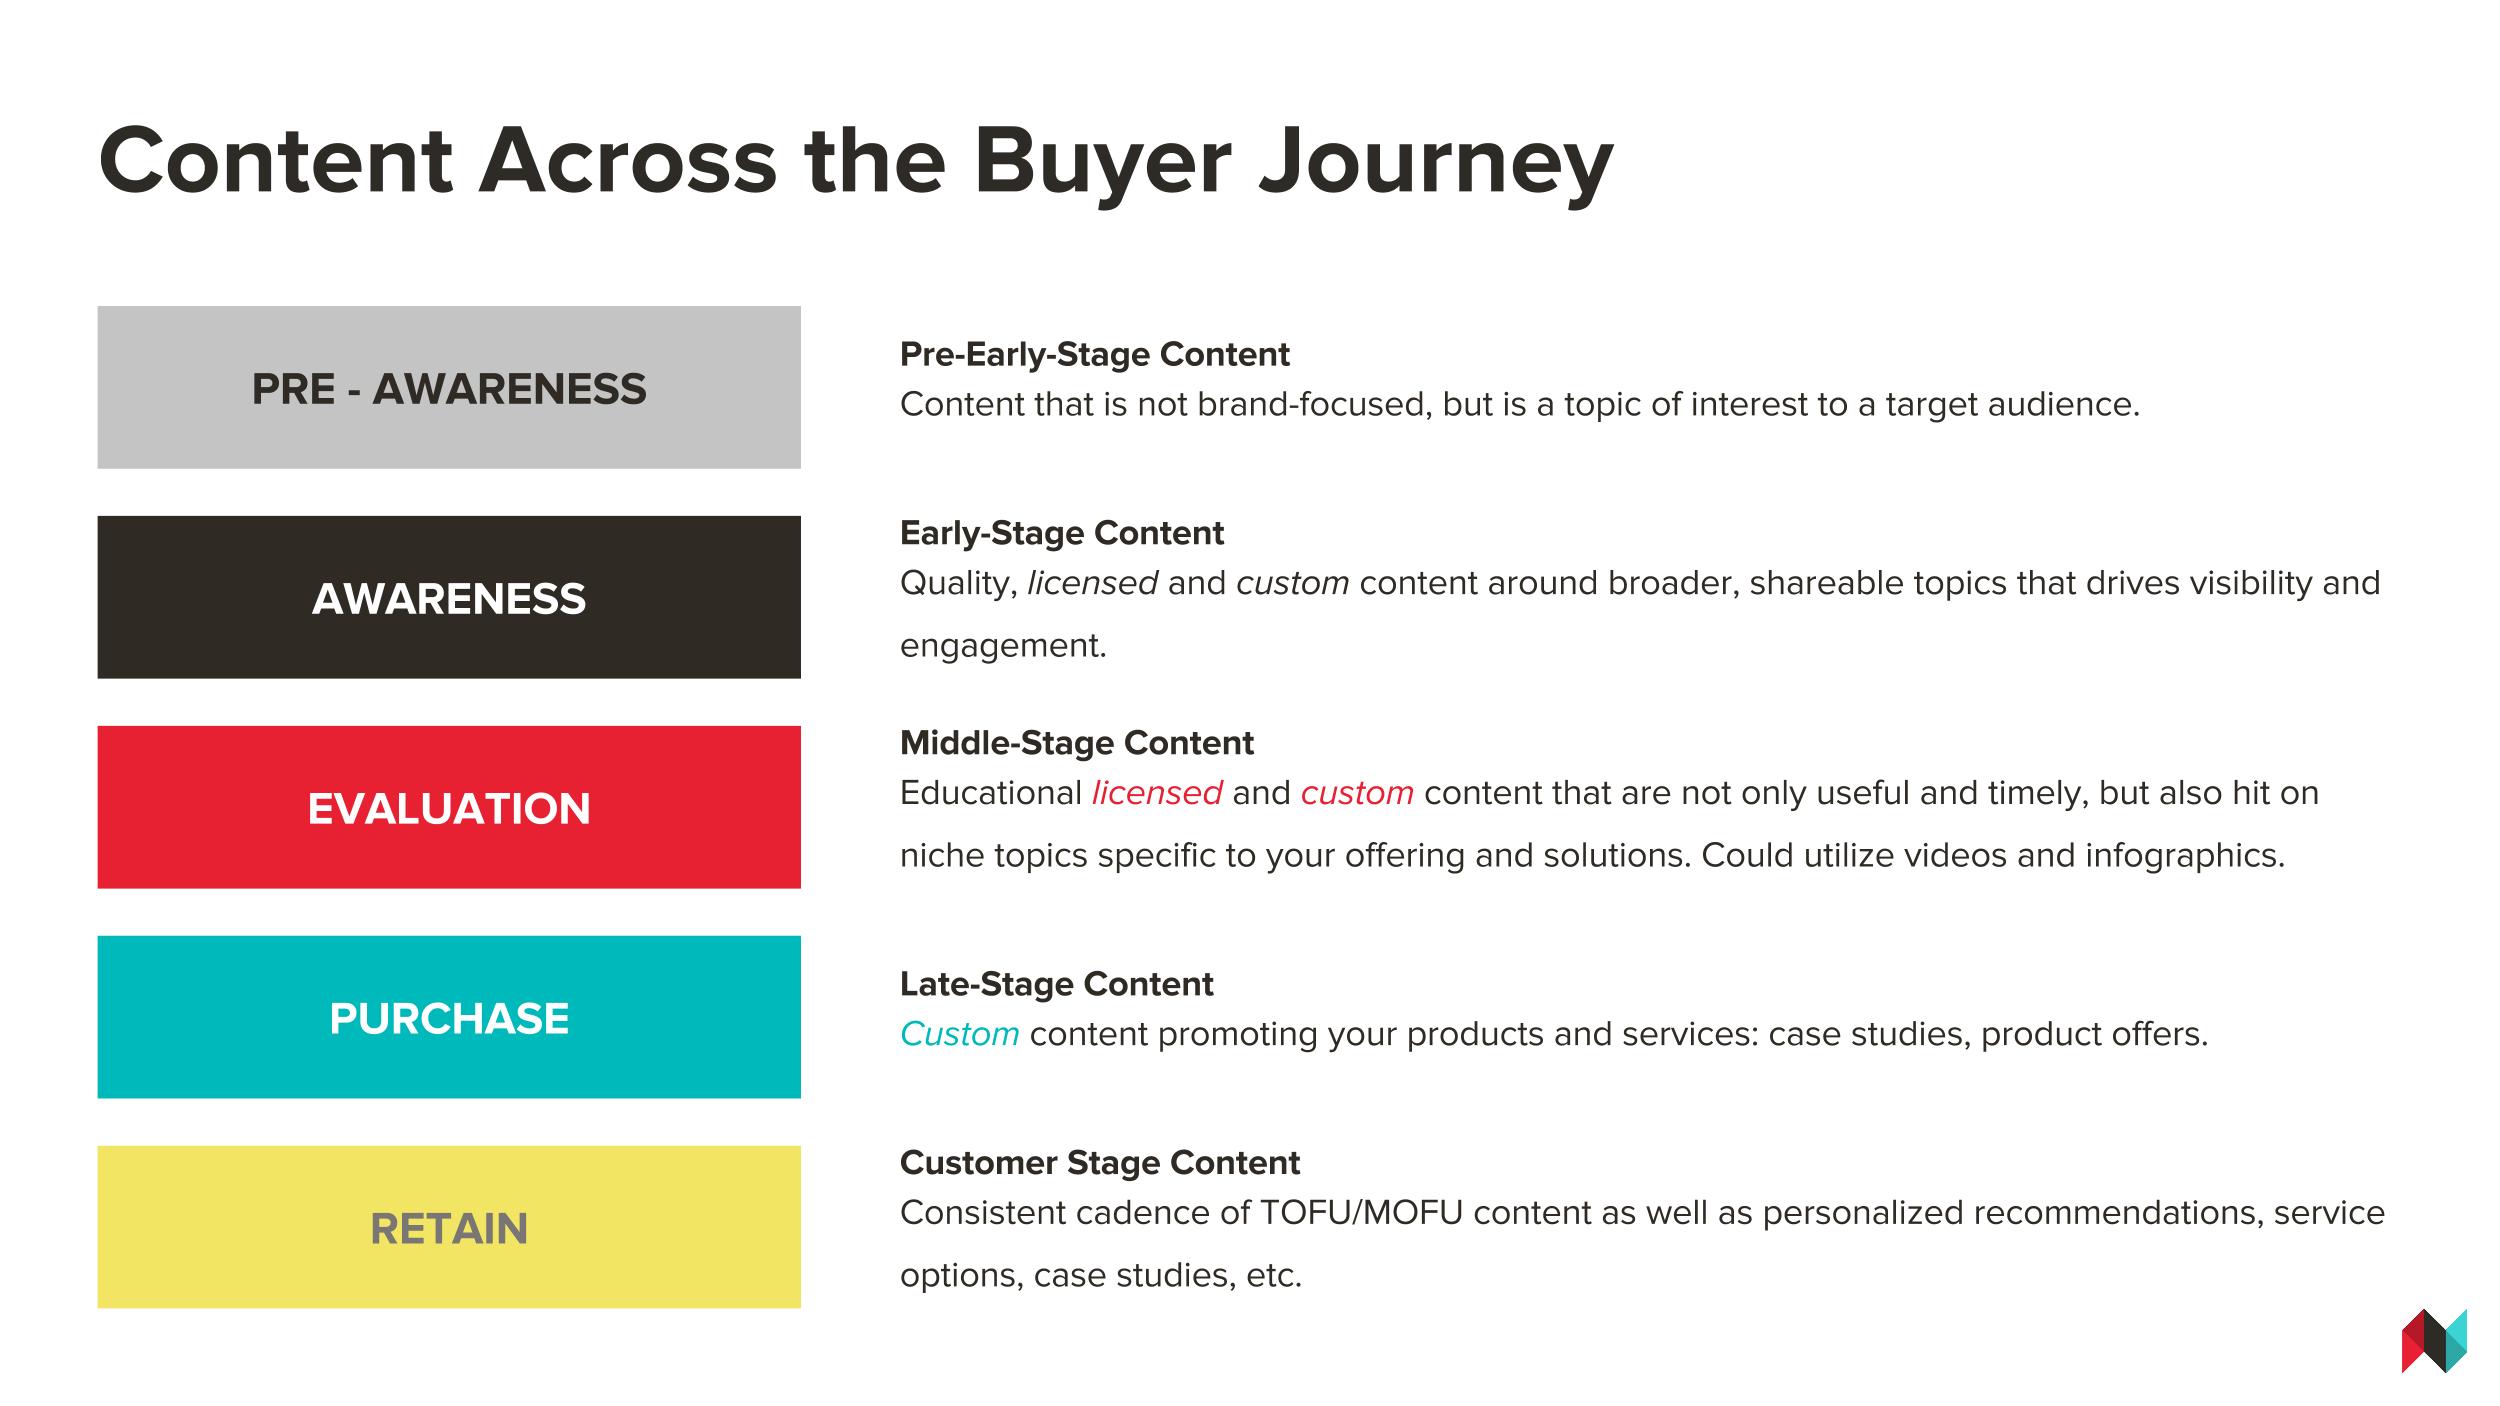
Stellen Sie bei der Erstellung von Inhalten für die Customer Journey sicher, dass Sie über Assets und einen Verteilungsplan verfügen, um bestehende Kunden zu binden.
E-Mail-Marketing ist sowohl für B2B- als auch für B2C-Vermarkter ein hervorragendes Kundenbindungsinstrument, wenn es um Loyalität geht.
Vergessen Sie Klicks.
Selbst wenn ein Kunde nur ab und zu sieht, dass Sie in seinem Posteingang auftauchen, reicht das aus, um in Erinnerung zu bleiben.
Er wird wissen, wo er Sie finden kann, wenn er bereit ist.
KPIs zum Messen:
Ermitteln Sie zunächst den Prozentsatz Ihrer Kunden, die Ihre Inhalte lesen. (Verwenden Sie dazu Ihre Marketing Automation Plattform.)
Betrachten Sie diese Kohorte und messen Sie dann die folgenden Werte im Vergleich zu Kunden, die Ihre Inhalte nicht lesen:
- Verlängerungs-/Abschlussrate
- Upsell-Rate
- durchschnittlicher Bestellwert/ACV
Bei Welcome haben wir festgestellt, dass die Kunden, die sich mit unserem Blog beschäftigen, loyaler sind und höhere Verlängerungsraten haben: 33% unserer Kunden abonnieren unseren Blog, und von diesen haben sie:
- haben eine um 41% höhere Verlängerungsrate als unser gesamter Kundenstamm (95% vs. 67%).
- Sie haben eine um 33% höhere Wahrscheinlichkeit für einen Upsold (23% gegenüber 17%).
- Sie zahlen monatlich 24% mehr an wiederkehrenden Einnahmen als der durchschnittliche Kunde.
Es wird zwar einige Zeit und Mühe kosten, die Systeme zur Messung dieser KPIs einzurichten, aber langfristig werden Sie ein viel besseres Bild davon haben, wie gut Ihre Inhalte im Vergleich zu Ihren Geschäftszielen abschneiden.
Sie werden in der Lage sein, Ihren Zielen konkrete Zahlen gegenüberzustellen, die Leistung im Laufe der Zeit zu messen und Ihr Programm entsprechend zu optimieren.
Und mit diesen Daten können Sie bei Ihrem CMO höhere Budgets für Content Marketing beantragen und in Ihrem Unternehmen mehr Zustimmung erhalten.

