Picture this: You're a product manager, standing at the crossroads of gut instinct and cold, hard data.
On the one hand, there's your intuition whispering sweet nothing about what your customers really want. On the other, a mountain of spreadsheets, charts, and user feedback forms saying, "Listen to me, I'm science!"
Say hello to data-driven decision-making. In the product development lifecycle, A/B testing, and statistical significance play crucial roles in shaping product strategies.
But here's a question: If data-driven decisions are so impactful, why do so many teams still struggle to make strategic decisions? Why do we desperately try to make sense of our data analytics dashboards?
Let's dive in and find out the answer on how to make informed decisions. Before you ask, it's not just all about the numbers, folks.
The data-driven dream (And why it's keeping you up at night)
First things first: What exactly are data-driven decisions?
In theory, the decision-making process is simple. Data collection is followed by data analysis so you can use those data sets and actionable insights to guide your business decisions. Easy, right?
Wrong.
In practice, it's a bit different for decision-makers.
For example, take Airbnb's smart pricing algorithm. It uses data to automatically set the perfect price for your rental. But go deeper, and you'll realize it has to consider everything from local events to weather patterns.
So, it's not perfect. Just ask any host who's accidentally rented out their place for $1 a night during Super Bowl weekend.
The truth is, that taking any initiative to get the right data and make better decisions is hard. Here's why:
- Data overload: We have too much data, but hardly any data sources that impact customer experience. It's hard to float your own boat talking about the same old boat. This is why it becomes important to understand what elements of data are useful for your purpose.
- Analysis paralysis: With so much data, it's tempting to keep analyzing... and analyzing... and analyzing. Before you know it, your competitors have launched three new features while you're still debating the statistical significance of your latest button color test.
- The human factor: We're not robots (yet). Our brains are wired with biases, and sometimes we see what we want to see in the data. It's like looking at clouds – if you stare long enough, you'll probably see whatever you're imagining.
The key is to balance data visualization with creativity. To understand the power of data-driven experimentation, let's look at Google's famous 41 shades of blue experiment.
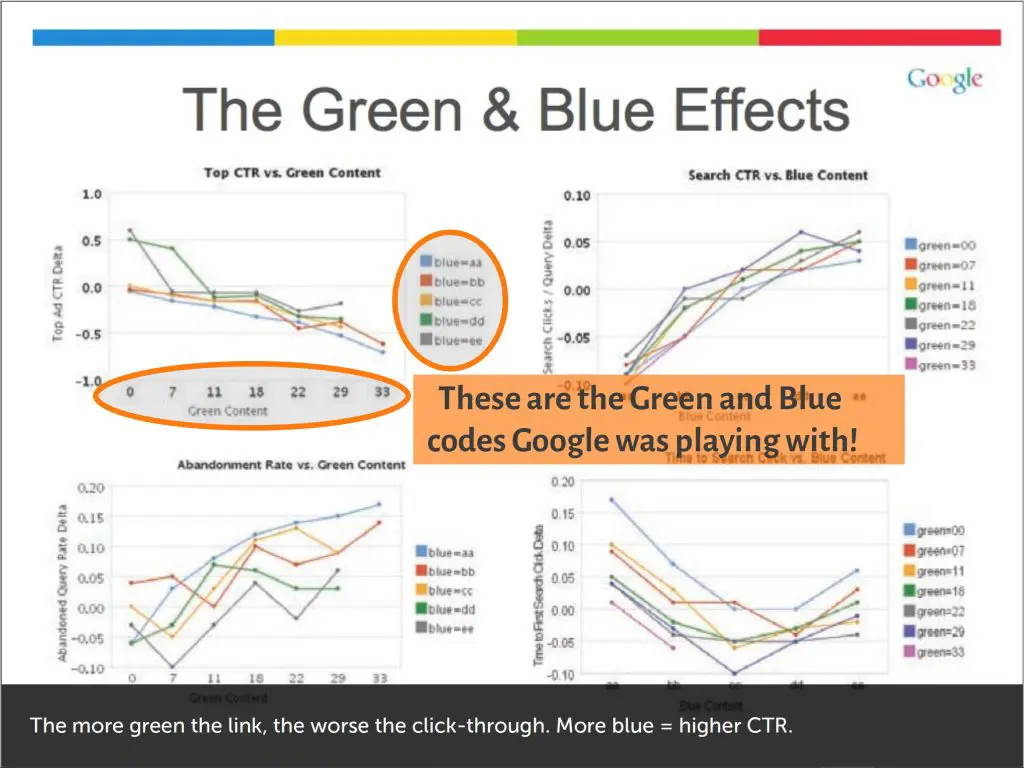
In 2009, data scientists at Google tested 41 slightly different shades of blue for their search results links, showing each shade to about 2.5% of users.
The hypothesis? Different shades could impact user engagement and click-through rates.
The results were surprising. The winning shade increased annual ad revenue by $200 million.
However, this experiment wasn't without controversy. It showed that even small changes can have significant impacts. Butit also raised questions about the balance between data and intuition in design. Overall, customer data should inform through valuable insights, not replace, human creativity and intuition in the design process.
The data-driven experimentation cycle
Now, let's talk about product experimentation at data-driven organizations. It's the process of testing ideas, features, and designs to see what actually works.
But here's where teams often hit a wall:
-
Hypothesis formation
Forecasting and coming up with a good hypothesis is hard, especially if you’re presenting in front of stakeholders. Everyone has an opinion, but no one's quite sure if they're right. "I hypothesize that adding glitter to our app icon will increase user engagement by 1000%!" (Or will it ✨)Here's what will help:
- Business intelligence is about starting with your product goals and user pain points.
- Use the SMART criteria: Specific, Measurable, Achievable, Relevant, and Time-bound.
- Use data-driven insights to frame your hypothesis in an "If...then..." format.

Source: Indeed Example: If we simplify the checkout process by reducing it from 5 steps to 3, then we might see a 5-10% increase in completed purchases over the next month.
-
Experiment design
Designing a clean experiment involves controlling numerous variables. Here's how:- Clearly define your independent and dependent variables.
- Use control groups to isolate the effect of your changes.
- Consider potential confounding factors and plan how to mitigate them.
- Use feature flags to deliver features without risks.
-
Analysis and interpretation
It's easy to draw incorrect conclusions, especially with limited data. Here's how you can use data literacy to analyze results better: - Look beyond just the numbers – consider data quality as well.
- Be wary of false positives and negatives. Run follow-up experiments to confirm results.
- Use visualization tools to help spot trends and patterns in your data.
- Build a culture of experimentation where it's okay for team members to be wrong – the goal is learning, not always being right.
Take an iterative approach towards experimentation instead of going with gut feeling. Begin with small, manageable tests, continuously refine your methods based on results, and progressively tackle more complex hypotheses as your team's expertise grows.
Five examples of data improving metrics performance
Data-driven decision-making can directly impact your performance metrics.
For example, Netflix analyzes viewing habits, search history, and user ratings to power recommendations, guide content creation, and optimize service delivery.
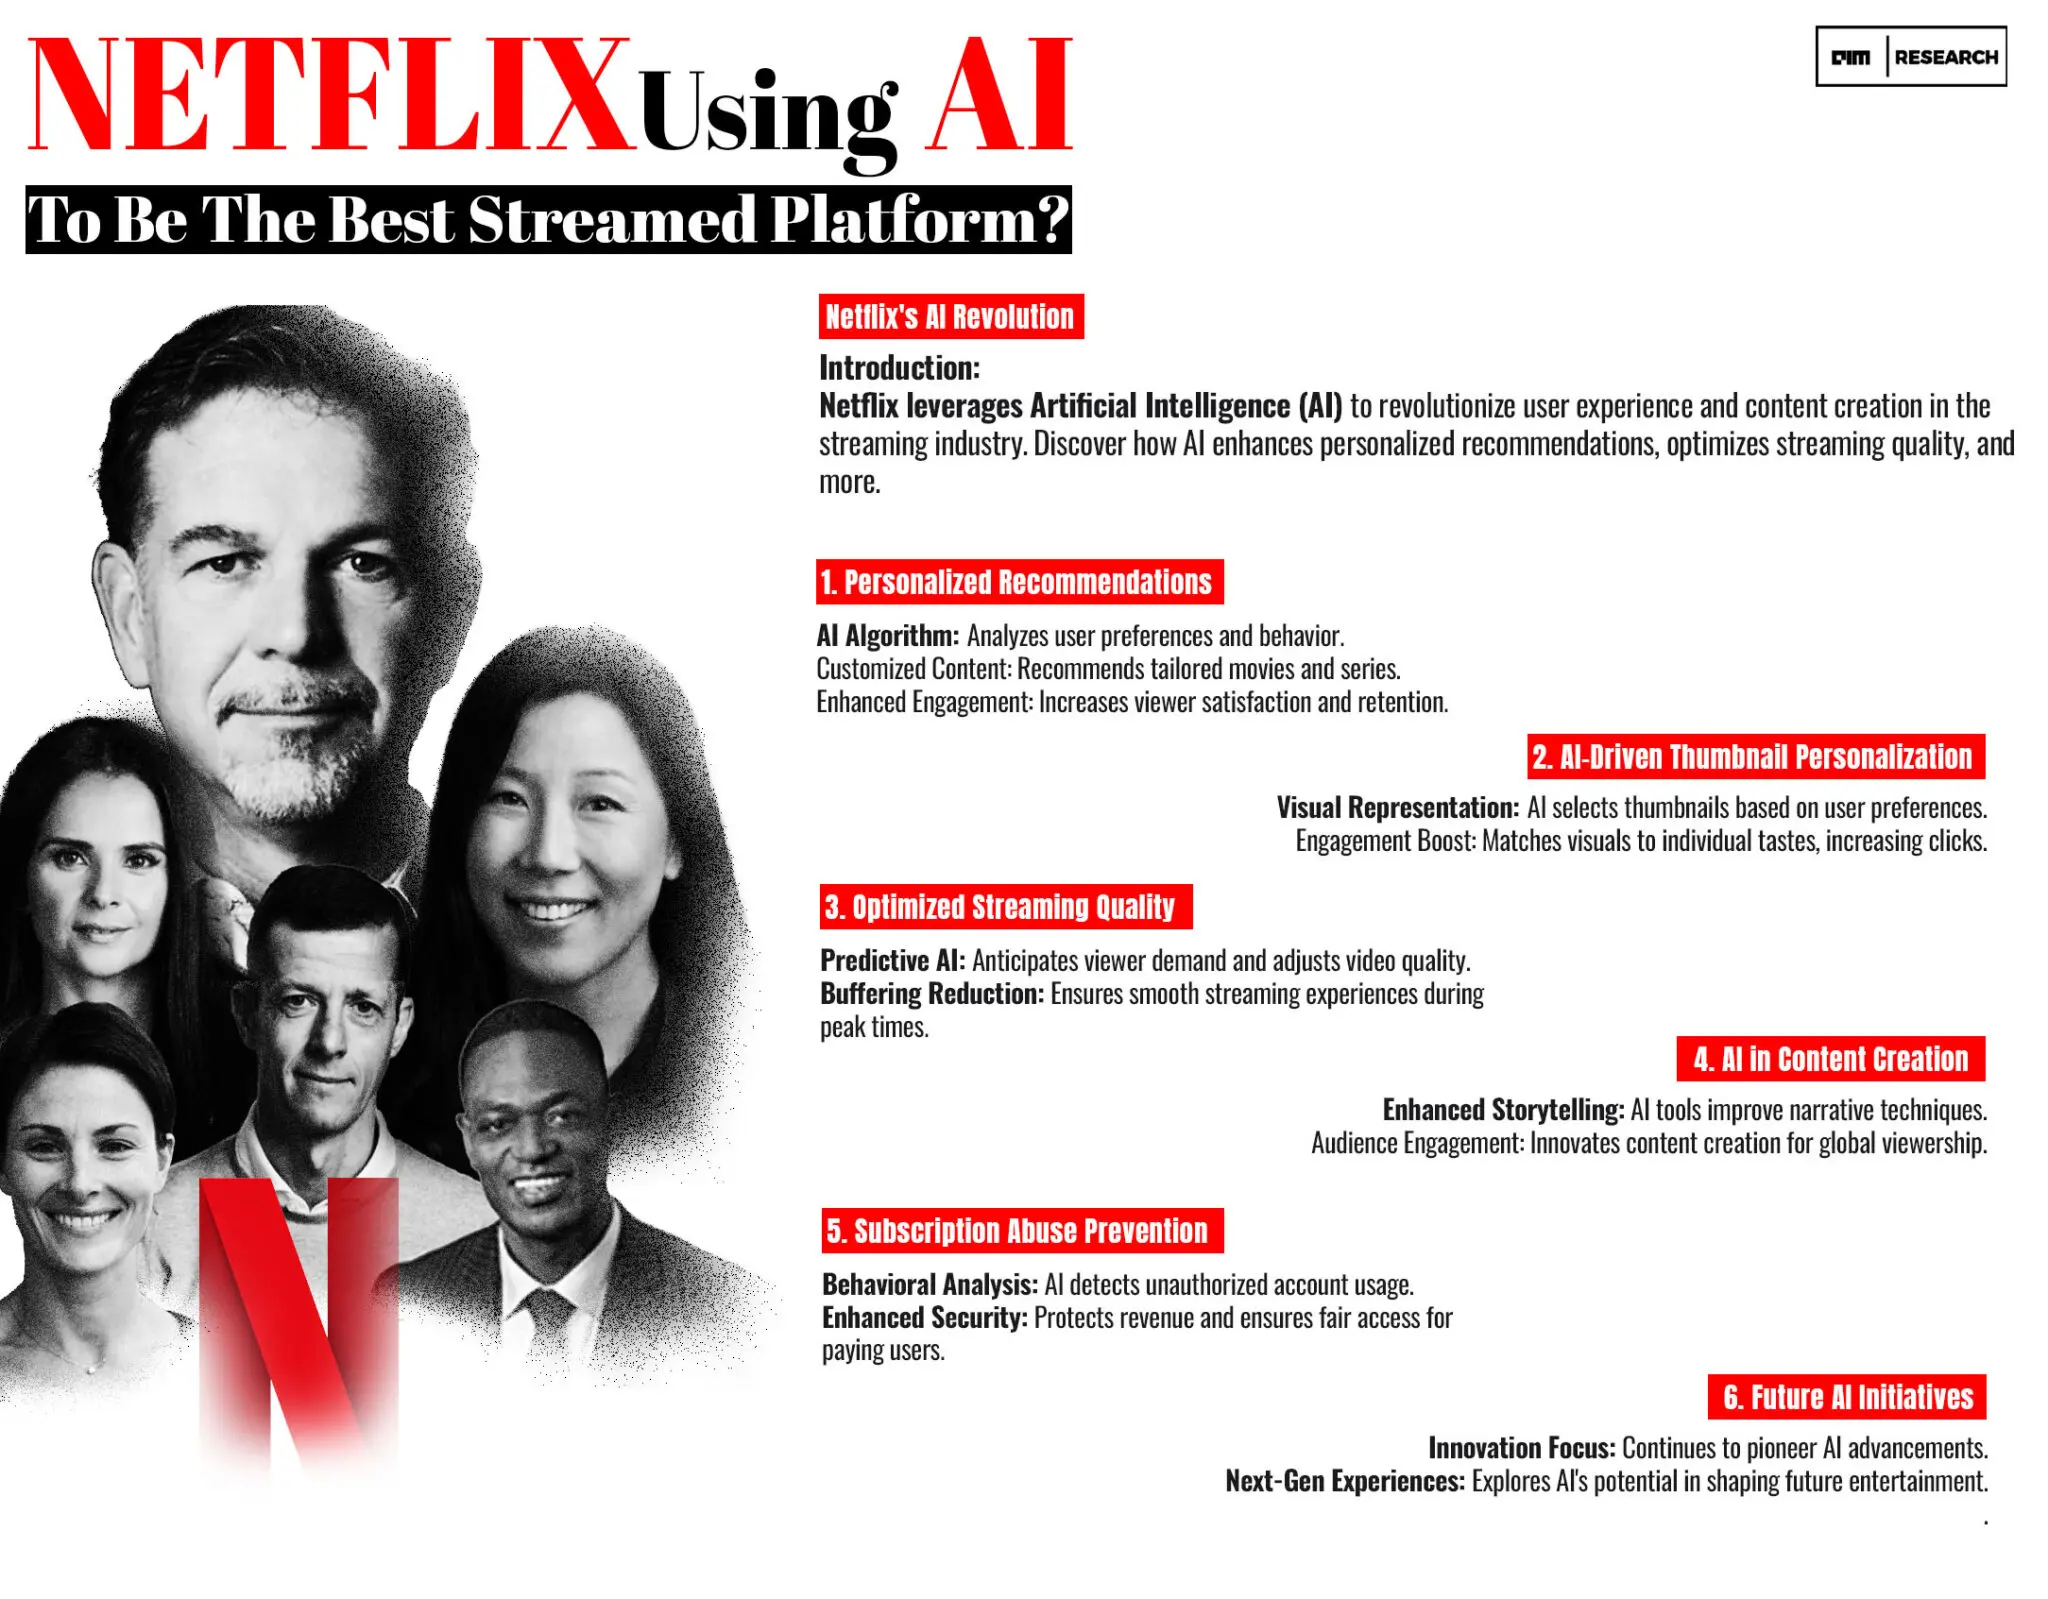
By leveraging this data-driven approach, Netflix not only recommends content but also predicts successful show concepts. Further, they can predict customer churn and take proactive measures to retain at-risk subscribers.
Netflix's success demonstrates how data can drive improvements across multiple performance metrics. Here are five key areas where you can use data to significantly enhance business performance:
Conversion rates: By analyzing user preferences, you can personalize website messaging, potentially leading to more users buying what you're selling. For example, by testing a new website design, ClassPass saw a 10% increase in the sign-up rate.
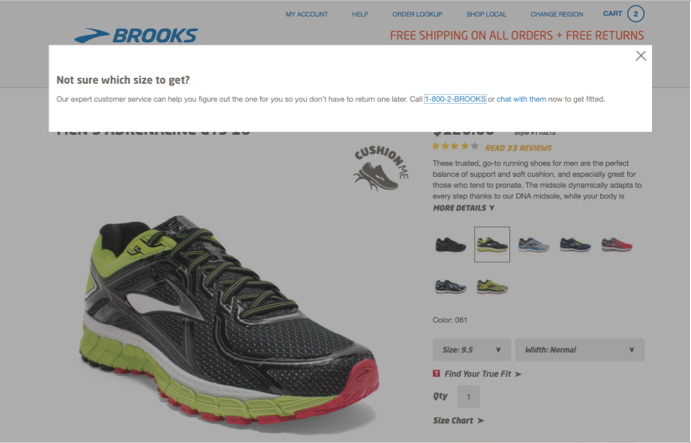
User engagement: Data can reveal which features or content users interact with most, allowing you to create more engaging experiences. Brooks tested the following message and got more orders with 88% saying they appreciated the customer service offer to help.
Customer Lifetime Value (CLV): By identifying at-risk customers, your key performance indicators (KPIs) can focus on creating personalized experiences and improving retention rates.
Product development: User feedback can inform product improvements and new feature development, ensuring you build products as per customer needs. See how DocuSign accelerated experimentation velocity by simplifying the data-driven decision-making process.
Checkout rate: You can look at analytics data and identify dropoff points or compare your checkout flow to competing sites to understand why shoppers are abandoning a cart. This is how Hunter Engineering used machine learning to increase monthly orders by 20%.
The data-driven promised land: Are we there yet?
While data-driven decision making offers immense potential, data management is not without its pitfalls. Here are the benefits of data-driven decision-making and how you can manage the pitfalls:
- Start small, think big: Begin with focused experiments that deliver quick wins. Build momentum, gain confidence in the process, and then start running complex experiments.
- Avoid p-hacking: P-hacking is about manipulating data analysis to manufacture statistical significance where none truly exists. The temptation to manipulate relevant data to achieve desired results is real. Foster a culture where the integrity of the experiment is more important than "positive" results.
- Deal with conflicting data: When data points in different directions, resist the urge to cherry-pick. Instead, dig deeper to understand the underlying factors causing the conflict.
- Foster data-driven culture: Allow your team to raise questions, challenge assumptions, and get comfortable with being wrong. For example, Booking dot com democratized its experimentation process, allowing all teams to set up and run experiments.
- Use the right tools: Feature management tools can help you control rollouts, segment users, and gather data efficiently for operational efficiency.
- Ensure statistical significance: One of the biggest challenges in experimentation is achieving statistical significance, especially with smaller sample sizes. Booking.com faced this challenge when experimenting on its experimentation platform. With only about 1000 experiments running in parallel, they had to carefully design their "meta-experiments" to ensure sufficient statistical power. They chose interventions with potentially large effect sizes and ran experiments for longer periods to overcome sample size limitations.
Most commonly used feature management capabilities
Feature management is crucial for safe, controlled, and data-driven product delivery. Here are some of the most commonly used feature management capabilities you can use to improve customer satisfaction levels:
- Use Feature Flags to toggle features on or off without deploying new code in real time.
- Use Gradual Rollouts to release features to a small percentage of users and gradually increase exposure, minimizing risks.
- Use targeted releases to only show features to specific user segments, such as beta testers, premium customers, or users in certain geographic regions.
- Use Multivariate Testing to compare different versions of a feature to determine which performs better against key metrics.
- Use Canary Releases to deploy changes to a small subset of users and test for issues before a wider release.
- Use Kill Switches to quickly disable a feature if issues arise, minimizing the impact of bugs or performance problems.
The goal isn't just to follow the market trends and ship features faster, but to deliver the right features that truly meet customer needs and drive business value.
Data-driven, not data-drowning
Mastering data-driven decisions isn’t about having all the answers—it’s about asking the right questions, learning from failures, and finding the sweet spot between data and intuition. While data provides critical insights, it’s the combination of both that drives the best product decisions.
Product experimentation helps you achieve this balance, removing the guesswork and allowing for smarter, more informed choices. To truly unlock its potential, understanding how product experimentation fits into your development process is key.
When you integrate experimentation early, you make sure the features you build are grounded in real customer needs—leading to products people actually want to use. By continuously testing and refining, you’ll be able to make better decisions and build things that truly resonate.
![]()

Yes, a marketer and a copywriter... but more lame than most. I try to use AI and here to be a thinker rather than just a publisher, but really just think with my...
- Last modified: 4/28/2025 2:50:47 PM