Using ratio metrics for enhanced experimentation insights
Experimentation requires precise measurement. Simple metrics are also ratios, just the denominator is often pre-defined as experiment visitors, while ratio metrics offer flexibility to define a custom denominator event for metric calculation.


When running experiments, selecting the appropriate metric is probably one of the most important predictors of how successful your experiment will be. Metrics are the compass guiding teams for insights that can be used to make better business decisions through your experimentation program. The precision of this guidance depends on the relevance and accuracy of the chosen metrics.
Ratio metrics expand your measurement capabilities by allowing you to combine aggregations of two different events within a single metric. This flexibility means you can construct metrics in your experimentation platform that directly align with the KPIs your business already tracks in other systems.
While simple metrics are based on a single event, ratio metrics give you the ability to create more complex measurements that better reflect your actual business metrics, helping you make decisions based on the same KPIs that drive your overall business strategy.
Note: Ratio metrics are available in Web Experimentation (WX), Feature Experimentation (FX), and Optimizely Analytics products.
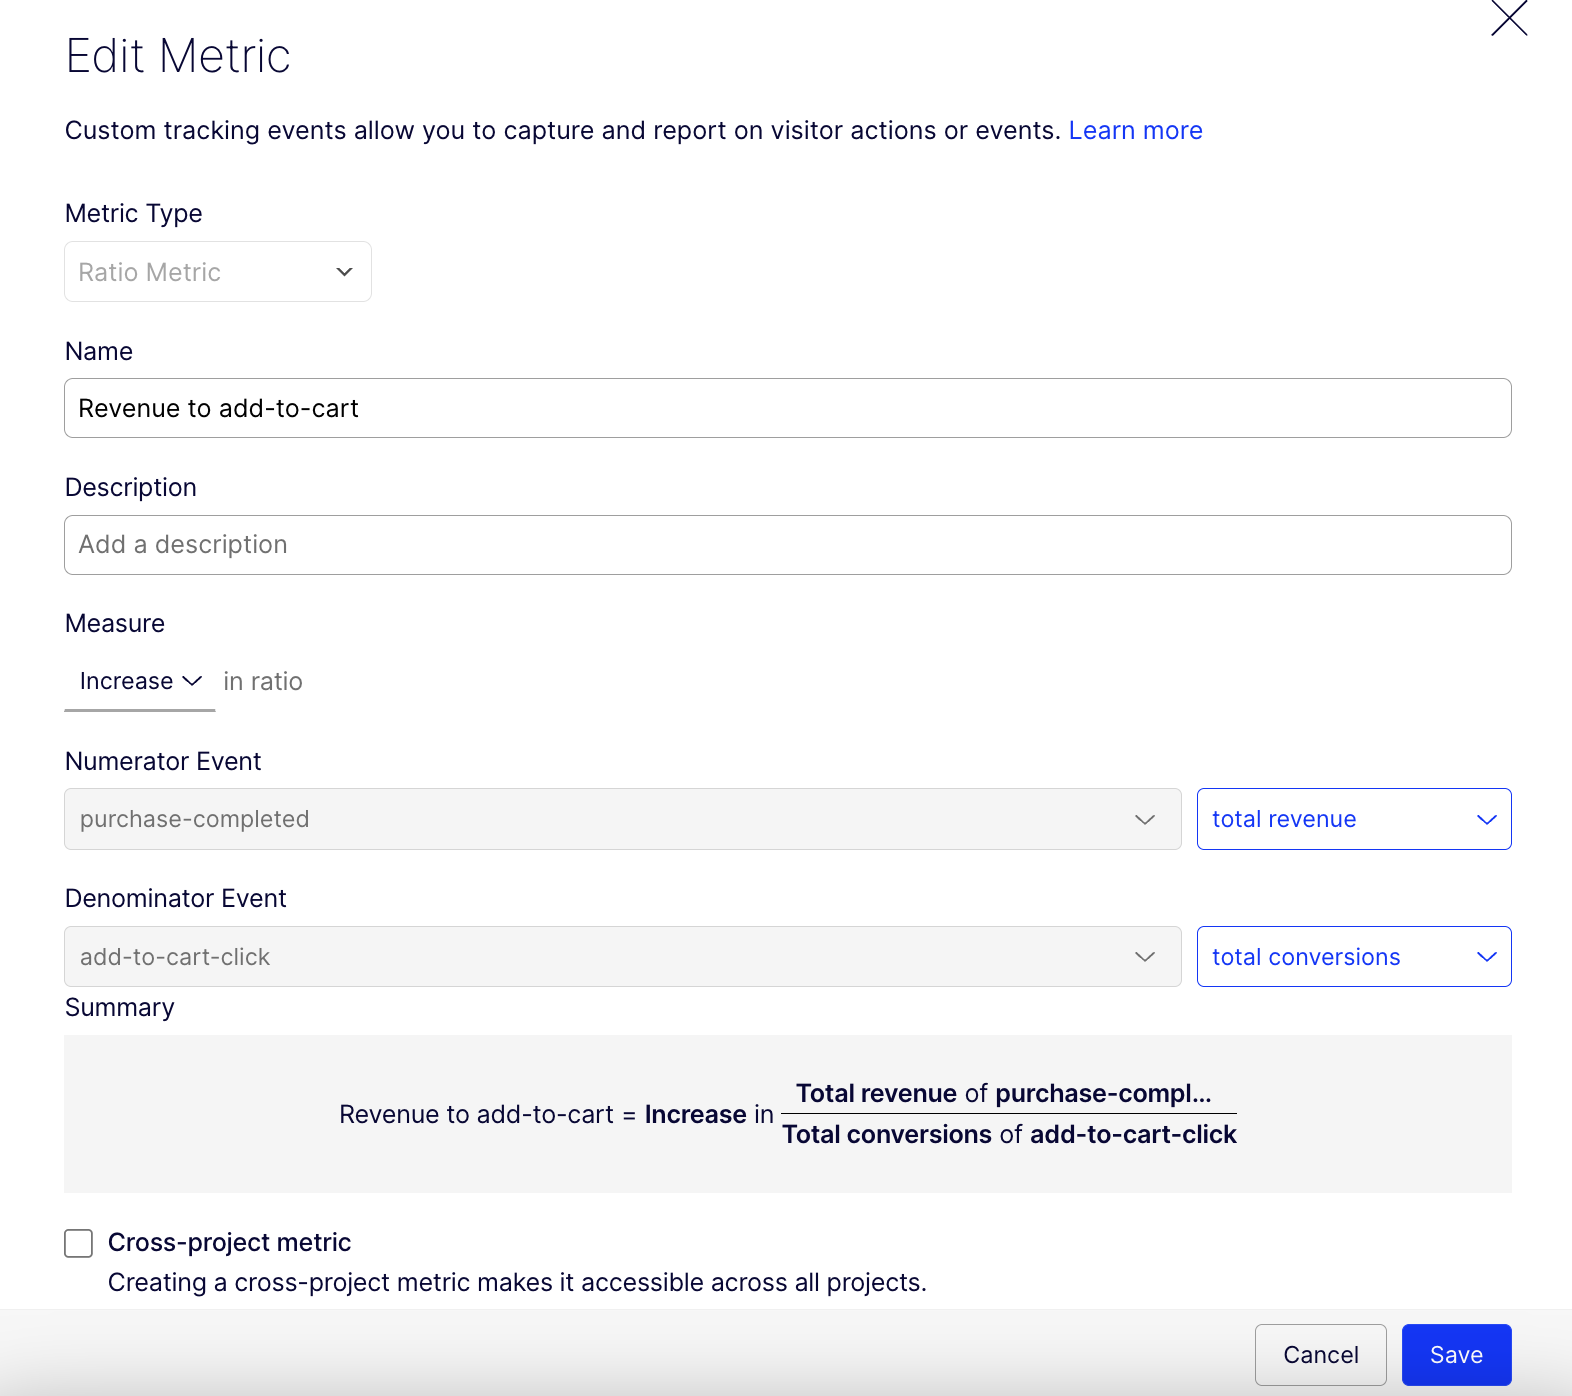
Image source: Optimizely
How do ratio metrics differ from simple metrics?
Simple metrics are more straight-forward to analyse and interpret, so always start with a meaningful simple metric. Our recommendation is to use simple metrics whenever they adequately capture what you're measuring, as they provide clearer, more trustworthy data points.
However, ratio metrics offer valuable flexibility when you need to align your experimentation with established business KPIs. Many organizations already use ratio-based metrics in their daily operations including metrics like "revenue per session," "purchases per account," or "average order value." Ratio metrics allow you to bring these same measurements into your experimentation program.
When using ratio metrics, follow these guidelines for accurate interpretation:
- Always include the component metrics: Add the numerator and denominator as separate simple metrics in the same experiment. This provides essential context for interpreting ratio changes.
- Watch for misleading signals: A ratio can improve due to a decrease in the denominator while the numerator remains unchanged. For example, "revenue per visit" might increase simply because visits decreased, not because revenue improved.
- Analyze in context: Use your analytics dashboard to see the bigger picture. Look at how both the numerator and denominator are behaving to understand what's driving the changes in your ratio metric.
Here's a peak into Optimizely results with a ratio metric.
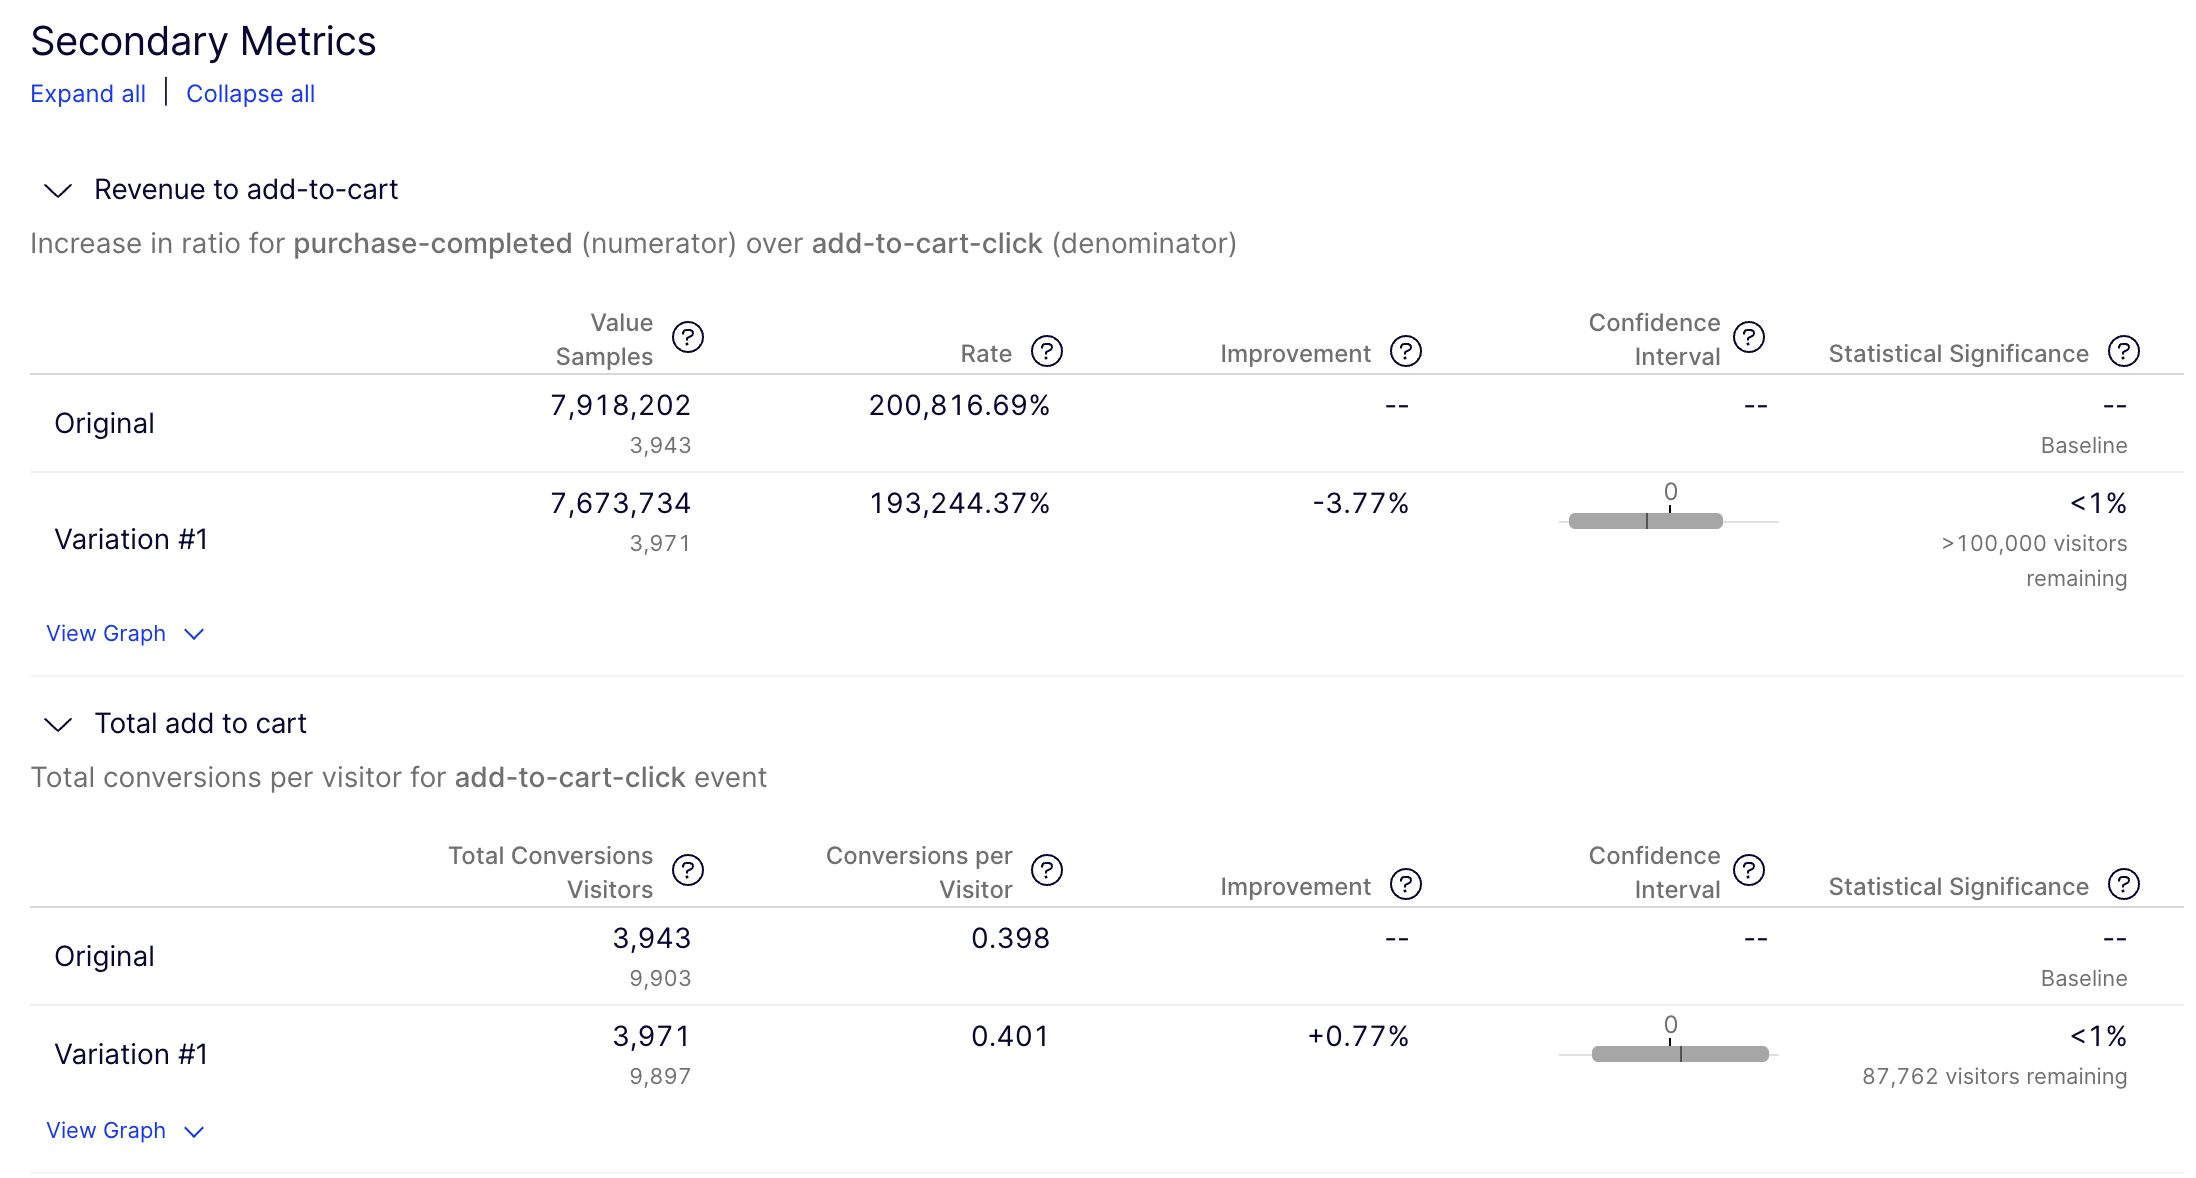 Image source: Optimizely
When could you use ratio metrics for A/B testing and experimentation?
Ratio metrics are particularly powerful when you want to customize your metric with a different denominator than what's typically used in simple metrics.
For example, instead of tracking revenue per user (a simple metric), you might want to assign your revenue to add-to-cart clicks. This ratio metric "revenue per add-to-cart click" allows you to measure the efficiency of your cart additions in generating revenue.
You can also track average watch time per account. Instead of per user, which helps subscription-based streaming services understand engagement at the household level.
Other examples:
- E-commerce product optimization: Instead of tracking simple revenue per user, measure Revenue per Add-to-Cart Click (Revenue / Add-to-Cart Clicks). This ratio metric helps you understand if your product page improvements are driving higher-value purchases when users engage, even if click rates remain stable.
- B2B SaaS platform: For enterprise software with multiple users per company, track Feature Adoption per Account(Total Feature Uses / Number of Accounts) rather than per user. This helps you understand organizational adoption patterns rather than individual usage.
- Streaming service content strategy: Instead of measuring watch time per user, track Total Watch Time per Household Account (Total Minutes Watched / Number of Accounts). This ratio metric provides insights into content engagement at the subscription level, which directly impacts retention.
Over all, ratio metrics allow you to construct measurements that better align with how your business evaluates performance, bridging the gap between experimentation data and your established KPIs.
Creating funnel-like metrics
When connection and order of events are important...
Because Optimizely calculates ratio metrics on a per-unit level, it's also possible to use them when analyzing the connection between two sequential events.
For instance, you can create a ratio metric that measures the percentage of users who submit a form (numerator event) after clicking on a promotional banner (denominator event). This creates something similar to a "funnel metric" by having count-type events in both the numerator and denominator.
This approach helps you assess conversion efficiency at specific touchpoints - like how effectively your promotional elements drive desired actions. You gain insights into the conditional relationship between these connected events, something a simple metric (such as total form submissions) wouldn't reveal.
However, it's important to remember that this application, while useful in specific scenarios, is secondary to the main purpose of ratio metrics: creating flexible measurements that align with your established business KPIs.
Wrapping up...
Ratio metrics provide valuable flexibility in your experimentation program by allowing you to construct measurements that directly align with the KPIs your business already uses. This alignment bridges the gap between experimentation data and the metrics your stakeholders care about most.
Remember these key principles when working with ratio metrics:
- Choose metrics that align with your established business objectives and KPIs
- Always examine the component metrics (numerator and denominator) for complete context
- Use the statistical capabilities of platforms like Optimizely to ensure reliable results
The most successful experimentation programs strategically select between simple and ratio metrics. Simple metrics offer clear, trustworthy data on individual events, while ratio metrics provide the flexibility to align with your organization's established KPIs.
Choosing the right metric type creates a measurement approach that connects your experiment results directly to metrics that drive business decisions.
About the author

Senior Product Manager
