Optimizely warehouse native experimentation vs. Amplitude, Statsig, and Eppo

Experimentation platforms determine how your team tests, learns, and optimizes for years to come. We built this honest comparison because buyers deserve transparent information about tradeoffs, not marketing pitches.
The goal isn't to convince you to choose Optimizely warehouse native experimentation; it's to help you choose what actually fits your needs.
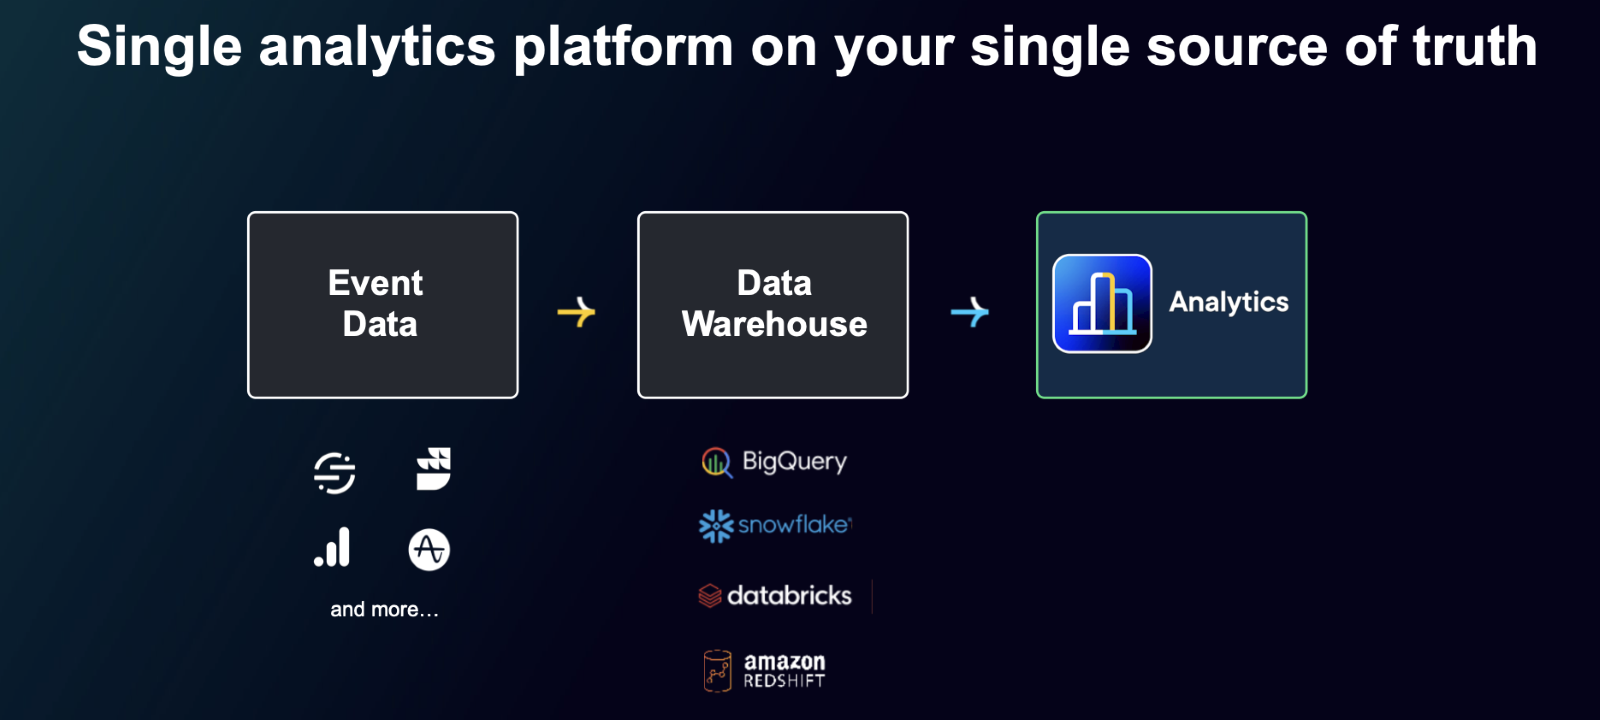
Warehouse-native experimentation platforms work directly with your existing data infrastructure—Snowflake, BigQuery, Databricks, or Redshift—eliminating data silos and connecting experiment results to business outcomes without reverse ETL or custom pipelines.
Here's a value-based comparison of warehouse-native experimentation platforms:
-
Optimizely vs. Amplitude
-
Optimizely vs. Statsig
-
Optimizely vs. Eppo
Let's get started.
1. Optimizely vs. Amplitude
Amplitude built a solid product analytics platform with strong user journey visualization and behavioral segmentation. They have a large community of users who like their interface. Experimentation has historically been a secondary part of their offering.
In May 2026, Amplitude announced it was taking over the Statsig brand, platform, and customer base. The engineers who built Statsig are at OpenAI from the September 2025 acquisition. Amplitude now owns Statsig's codebase without the people who wrote it.
Two experimentation products inside one company
Amplitude already had its own experimentation product before this deal. Now it has Statsig's too. That's two overlapping platforms being maintained by a team that did not build one of them.
For buyers, this changes the math. Anything Amplitude promises about Statsig's capabilities is hypothetical until they ship it. It's like a race car without a driver.
Event-based pricing adds up fast
Amplitude uses event-based pricing, which can become expensive quickly. A typical e-commerce site tracking onboarding steps and cart abandonment can hit 50,000 monthly events with just 2,000 users. As you scale, you pay for events you set up but no longer use.
More importantly, Amplitude locks your data into its system. Want to connect experiment results to customer lifetime value data sitting in your warehouse? You'll need reverse ETL and engineering time to make it work.
The gap
Amplitude excels at analytics, but your data lives in Amplitude's system, separate from the rest of your business data in your warehouse. You cannot easily connect experiment results to customer lifetime value, revenue data, or other business metrics without ETL and engineering effort. As your data infrastructure matures, this mismatch becomes increasingly costly.
The Statsig acquisition does not solve this. Amplitude inherited a warehouse-native platform without the engineers who built it, and until that integration is complete, customers are waiting on a promise, not a product.
Amplitude works if:
- You need product analytics with established user journey tools
- Session replays and heatmaps are critical to your workflow
- Event-based tracking meets your needs and you don't need to connect analytics data to your broader data warehouse
- You are comfortable waiting on an unproven integration roadmap for advanced experimentation
Consider Optimizely instead if:
- You've invested in a data warehouse (Snowflake, BigQuery, Databricks, Redshift) and want experimentation that works directly with your existing infrastructure
- You need to connect experiment results to business data (revenue metrics, CRM data, customer lifecycle information) without ETL
- You want rich product analytics built specifically for experimentation insights, powered by your warehouse
- You need a platform still built and backed by the team that created it
Six reasons to choose Optimizely Analytics over Amplitude:
| Optimizely Analytics | Amplitude | |
| AI | Agents that build explorations and data experiments with context on the entire customer journey. | Product analytics-focused. Limited context beyond your behavioral data. |
| Data architecture | Warehouse-native, working with your existing Snowflake, BigQuery, Databricks, or Redshift infrastructure. | Warehouse-native deprecated and no longer available to new customers. |
| Pricing model | Predictable Pricing without event overages. | Event-based pricing that escalates with growth (50k events with just 2k users) |
| Cross functional collaboration | Single tool for product, marketing, customer success, and data teams, all working from the same source of truth. | Primarily built for product teams; marketing and customer teams often need separate tools. |
| Platform scope | Analytics, experimentation, personalization, AI, and content management in one platform + MCP support for connecting to your existing stack. | Strong analytics but two overlapping experimentation products to integrate after acquiring Statsig in May 2026. |
| Data ownership | Your data stays in your warehouse - single source of truth. | Data locked into Amplitude's system requires reverse ETL for complex cross-analysis. |
Most importantly, Optimizely Analytics enables self-service on your single source of truth. The biggest challenge for growing teams is managing multiple analytics tools, each maintaining its own copy of your data. When Google Analytics reports 53 site visits, Amplitude shows 55, and your internal dashboard says 58, you're left wondering which number to trust.
This is the exact problem DataSnipper solved when they replaced Amplitude, Power BI, Mixpanel, Vitally, and HubSpot reporting with Optimizely Analytics.
Senior Product Manager Zack Porach described it like this:
"Mixpanel does its own thing, same with Amplitude, same with HubSpot — they're all really opinionated about how things should be."
Different teams were pulling different numbers for the same metric, and the data team spent hours validating which number was right. With Optimizely's warehouse-native approach, all teams analyze the same data from your warehouse.
2. Optimizely vs. Statsig
Statsig was built for engineering teams who want focused experimentation tools. They kept things simple and technical, which resonated with developers. As of May 2026, Amplitude announced it was taking over the Statsig brand, platform, and customer base. The team stayed at OpenAI. Amplitude now owns the code without the people who wrote it.
The collaboration tradeoff
Even before this deal, Statsig was narrow in scope. If your experimentation program involves marketers, product managers, and data analysts working together, you’d hit limits quickly. Their analytics focused on core experimentation metrics but lacked the depth for broader business analysis. Limited collaboration features and minimal self-service for non-technical users meant most teams ended up building additional tooling on top.
That gap is now harder to close, because the team that would have closed it is at OpenAI.
Here are 6 reasons to choose Optimizely Analytics over Statsig:
|
Optimizely |
Statsig |
|
|---|---|---|
|
Zero flicker, no slowdown |
The most performant way to deliver variations with zero latency with Edge Delivery |
Performance limitations can cause slower load times |
|
Experimentation analytics |
Connect user behavior to business outcomes directly in your warehouse, so you can finally prove what's working and accelerate growth |
Warehouse-native but requires technical expertise; limited self-service capabilities for non-engineering teams |
|
Modern editor |
Our WYSIWYG editor is compatible with the latest JS frameworks. 1,000+ customers running millions of experiments over a decade |
Requires custom coding for most variations; no visual editor for non-developers |
|
Innovation at core |
500+ features released last year. AI features are updated every month. |
Amplitude is now maintaining two experimentation platforms with the team that built one of them at OpenAI. Innovation pace depends on integration work that has not started. |
|
AI |
Agents for variation generation, ideation, planning, and results summaries. Stop waiting for devs. | Basic copilot assistance for hypothesis generation and experiment summaries |
|
Pricing |
Trusted long-term provider with consistent investment in enterprise success |
With two experimentation products to maintain and a major integration underway, pricing is one of many open questions for customer |
Statsig works if:
-
Your experimentation program is purely engineering-driven
-
You are comfortable making a platform decision based on what Amplitude says they will eventually build, with no committed roadmap dates
Consider Optimizely instead if:
-
Cross-functional collaboration is essential to your experimentation program
-
You need a platform where the team that built it still backs it, not a codebase Amplitude is working through without the original developers
3. Optimizely vs. Eppo
Eppo was an experimentation platform similar to Statsig, targeting technical teams who wanted to run experiments directly on their data warehouse.
After being acquired by Datadog, Eppo’s original platform was scrapped. The team announced that they “started again from the ground up,” launching two new products – Datadog Feature Flags and Experiments – built around observability, not experiments connected to business outcomes.
What happening now
Datadog Experiments launched in April 2026. It carries over Eppo's statistical methods — sequential testing, CUPED variance reduction, and real-time results but wraps them in Datadog's observability stack. The new product's priorities are canary releases, automated rollbacks triggered by latency and error monitoring, and infrastructure-tied guardrails. These are engineering problems, not the business experimentation questions that product managers and marketers typically need answered.
Datadog says the product is for "every product manager, designer, and engineer." In practice, it lives inside Datadog, a platform many non-engineering teams have never even logged into.
Here are five reasons to pick Optimizely Analytics over Eppo:
| Optimizely Analytics | Eppo | |
| Purpose-built for all teams | Designed for cross-functional teams with intuitive tools for product managers, marketers, and developers | Rebuilt under Datadog for technical users running canary and infrastructure tests not product or marketing teams |
| Unmatched performance | Delivers real-time experiment results with world-class stats engine ready OOTB | Carries over Eppo's statistical methods (sequential testing, CUPED), but within a brand-new product that's still maturing |
| Modern analytics | Built-in journey, funnel, and performance analytics with AI-powered insights working off your warehouse as a single source of truth | Tied to Datadog's product analytics, a recent and still-developing offering and RUM |
| Proven enterprise maturity | 14+ years of experimentation expertise with advanced features like contextual bandits and ratio metrics | Starting from scratch means months before the new products reach feature parity with what Eppo offered originally |
| Clear, dedicated roadmap | Dedicated roadmap centered on experimentation, feature flags, and personalization | Experimentation is now one of 58+ products in Datadog's catalog, not a dedicated focus |
Datadog Experiments works if:
-
Your priorities are geared towards observability, not experimentation or analytics. Your data engineering team can handle complex setup and ongoing maintenance
-
Your team already lives in Datadog and wants experimentation in the same platform
-
You're comfortable adopting a product that launched recently and is still building out its feature set
Consider Optimizely instead if:
-
You need analytics and experimentation in one platform, not just experimentation bolted onto an observability tool
-
You want product and marketing teams and not just engineers to be able to create and run experiments
-
You need continuity, not a rebuilt product
-
You need to connect experiment results to business outcomes like revenue, subscriptions, and customer lifetime value
Most analytics tools aren't built for (all) your data...
Your experiment results live in one system. Your revenue data sits in another. Customer lifecycle metrics are somewhere else entirely. When you need to connect A/B test performance to actual business outcomes like churn or lifetime value, you hit a wall.
Traditional experimentation platforms either lock your data into their tracking systems or require complex data modeling before you can run tests. Want to see how that homepage experiment affected six-month retention? You'll need ETL (Extract, Transform, Load), custom data pipelines, and weeks of engineering time.
The result: Duplicated data, escalating costs, and data teams who became experiment setup machines instead of strategic advisors.
While everyone expects you to be a data engineer to run experiments. We don't.
So, we took a different path with Optimizely Analytics. Instead of retrofitting analytics onto an experimentation tool, we built warehouse-native architecture from the ground up with experimentation, analytics, and AI designed to work together as one platform.
It's experimentation + analytics that work with your existing data stack, with zero data duplication.
Source: Optimizely
What this means for you:
- Self-service without limits: Non-technical users can analyze trustworthy results on all your data, not just what fits into someone else's tracking model.
- Release your geniuses from the queue: Your data team stops being human dashboard generators and becomes strategic advisors.
- Zero data duplication: Warehouse-native architecture that works with your existing infrastructure, including Snowflake, Databricks, BigQuery, and Redshift, whatever you'veinvested in.
- Unified platform: Experimentation, analytics, feature flags, and personalization working together instead of requiring integration gymnastics.
While competitors rush to add basic AI features, at Optimizely, we believe AI isn't a nice-to-have. It's essential to scale your program and increase program velocity.
Three actual use cases to help you drive business impact:
1. Chat with your data
Ask questions like "Which features do enterprise customers adopt fastest?" in plain language and get instant visualizations without knowing schemas or SQL.
Image source: Optimizely
2. Exploration summaries
Click any chart to get business-context explanations.
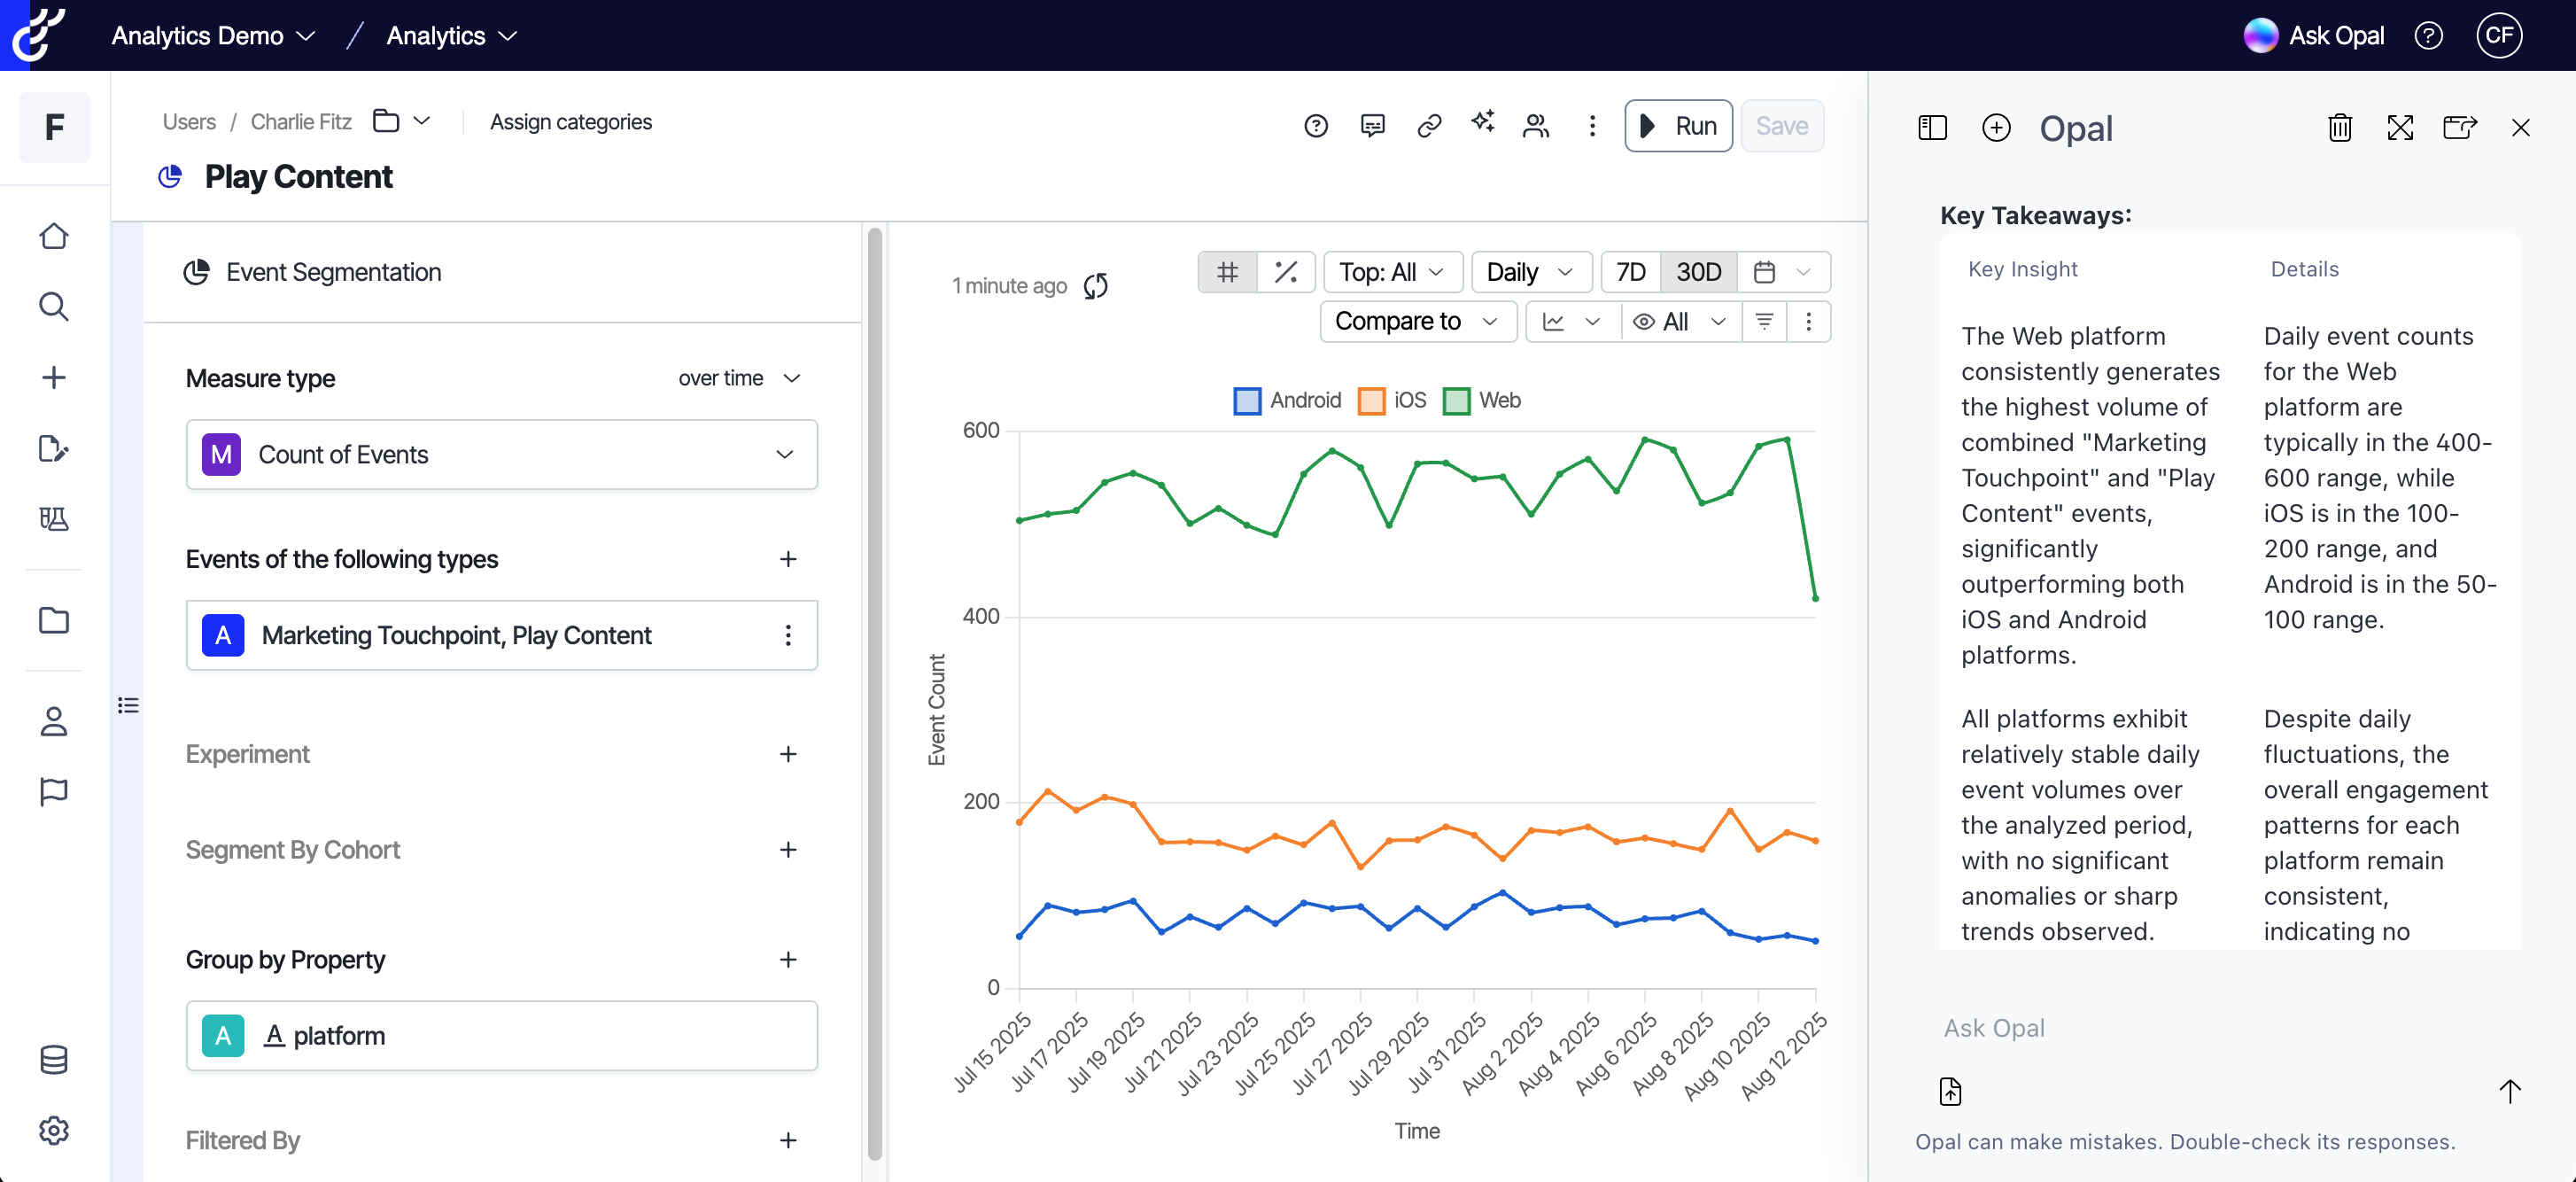
Image source: Optimizely
After AI has created a couple of explorations for you, creating your own becomes much simpler.
From there, you can use the built-in visualization templates to start with an empty template and utilize various explorations to tailor your dashboard and reporting needs.
3. AI agents
Our AI agents are already transforming how teams run experiments:
- Experiment ideation agent: It analyzes your complete dataset to generate high-value test ideas based on actual user behavior patterns, drop-off points, and conversion data, not gut feelings.
- Experiment planning agent: It recommends metrics that reach statistical significance faster by analyzing your traffic patterns and business context, cutting planning time by 19%.
- Variation development agent: It builds production-ready components—countdown timers, navigation buttons, form variations in minutes without developer resources, helping teams launch experiments 60% faster.
- Results summary agent: It automatically generates polished PDF reports with conversion insights and next-step recommendations, instantly delivered to stakeholders while results are still actionable.
Wrapping up...
While competitors rush to add AI features on flawed foundations, we built the architecture right first.
We're not just asking "what should we test?" but "how do we connect test results to the business outcomes that matter?"
Then, giving you the tools to find those answers in your existing data infrastructure.
Your warehouse has the data. Your experiments have the insights. Choose a platform that connects them directly.
See Optimizely Analytics in action
Vanliga frågor om A/B-testning

Ja, en marknadsförare och en copywriter ... men mer lam än de flesta. Jag försöker använda AI och här att vara en tänkare snarare än bara en publicist, men egentligen...
- Last modified:2026-05-19 11:55:59